Subsections of Reporting
Account Search
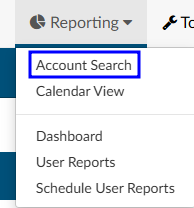
Account Search is helpful for reporting when creating a report that is not in the default user reports. Account Search allows the user to search most data points to export the raw data into a CSV file.
Sample Use Cases:
- How many inpatient accounts were discharged last month with a pricipal diagnosis of sepsis?
- What accounts were discharged with pending reasons?
- Of the inpatient accounts coded and then discharged last month, what is the total of each CC and MCC?
To answer any of the questions above, the data will need to be filtered as Account Search can pull all account/chart data available in the system.
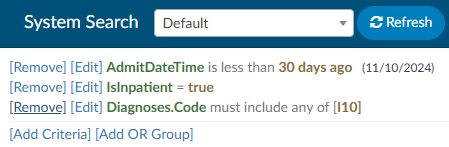
Setting Criteria
Account Search is highly dynamic in the types of data users can pull. Account Search, much like workflow, has two different options to create a filters using the AND/OR criteria.
AND Criteria
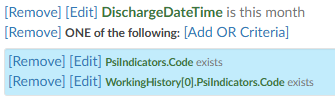
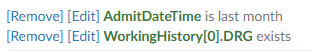
When using AND criteria, think about adding AND at the end of each criterion. For example, this criteria will cause the account search to display results if the patient chart had both the coder AND the CDI user identifying a PSI.
OR Criteria
When using OR criteria, think about adding OR at the end of each criterion. The OR criteria will display in blue to differentiate between the first and second criteria that will trigger the results. For example, this criteria will cause the account search to display results if the patient chart had either the Coder OR the CDI user identifying a PSI.
Start to filter the data by clicking the appropriate criteria button and selecting fields to constrain the data.
Continue to constrain the data for the desired results. There are over 250 fields that can be used to constrain the data. Each organization will have their own custom fields, depending on how the system was configured.
Selecting Columns
Once the data has been constrained, select the columns to display by selecting Columns.
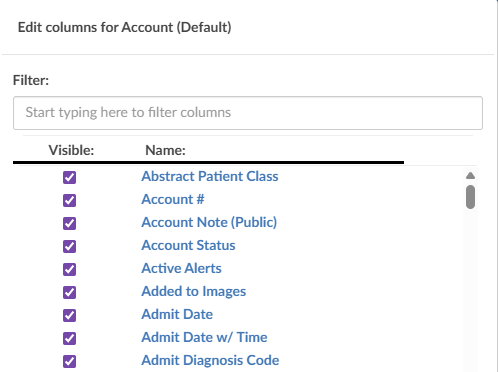
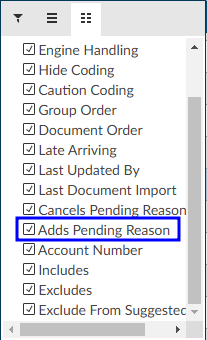
When the results are initially returned, there will be more column fields displayed than needed. Users can pair down the columns by removing or adding the columns as needed. Clicking on the drop-down arrow on Columns allows the user to select or unselect all columns. Use the check box to indicate the column should display and uncheck it to remove the column from the Account Search or Scheduled Account Search report. The filter box at the top of the list of columns will narrow down the available fields as the user types.
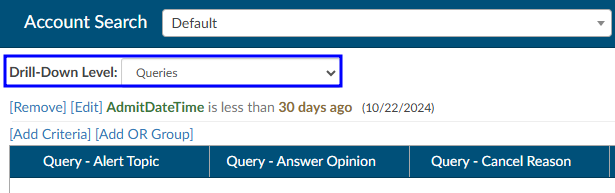
Drill-Down Level
Account Search allows for the ability to search for account level data or drill down to an array of different data collections.
- Account (Default)
- Audits
- CDI/Clinical Alerts
- Denials
- E/M Charges
- Final Assigned Codes
- Final CPT Codes
- Final Diagnoses
- Final Procedures
- Final Visit Reasons
- Pending Reasons
- Physician Coding Assigned Codes
- Physicians
- Queries
- Working Assigned Codes
- Working CPT Codes
- Working Diagnoses
- Working Procedures
- Working Visit Reasons
- Worksheet History
When a choice other than Account, which is the default view, is selected the columns for that choice are added to the beginning of the original grid. The drill-down level can be saved to the grid. For example, if there is search the user has saved called Unsubmitted, and the user added the Final Procedure drill-down to it, then when Unsubmitted is pulled up in Account Search it will include the drill-down columns. Additionally, the name of the drill-down will appear in the drill-down level field instead of the default of Account.
Searching for Data
The data filter allows user to constrain the data before returning results in account search grid.
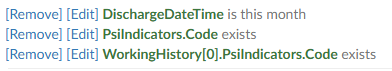
For example, a search for patient charts that CDI reviewed in the previous month might look like this:
To learn more about the fields and how they are defined, navigate to the Fields section in this user guide.
Sort and Filter Results
Each column has menu options to filter the data to restrict the view for only the data the user has defined.

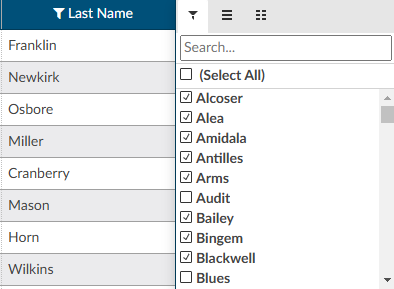
To manually filter:
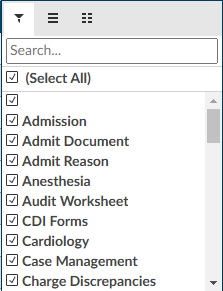
- Click the 3 lines on the column to be filtered
- Click on the Filter icon
- Check or uncheck the boxes depending on the data to be filtered
- Click on the filter to close the box
Additionally, users can choose to group the data creating a pivot table.
Using the data to create a pivot table allows users to reorganize the selected columns and rows of data in the account search grid table to obtain a desired report. The fields that can be filtered on and/or displayed can be found in the Fields section in this user guide.
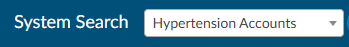
Saving a Search
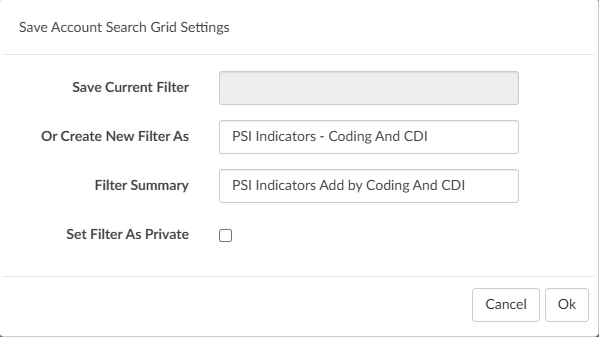
Account searches can be saved for future use.

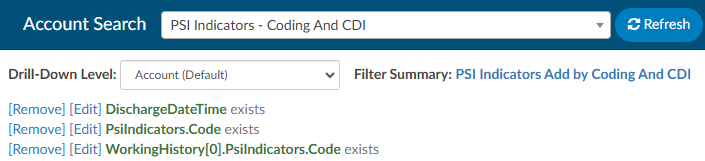
When saving a search, a new field will show in the save box called Filter Summary. If filled out, the summary will show in the banner of the search next to the Drill-Down Level.
Scheduling a Report
When a search is saved, a +Add Scheduler button will appear for users in Account Search to open a dialog box to create/edit/delete a schedule. Each saved search can have one schedule.

Once the user fills this out and saves, the button changes so the user can edit the scheduled report from account search.

Users can also see the account searches that were scheduled under the reporting tabs and scheduled user reports.
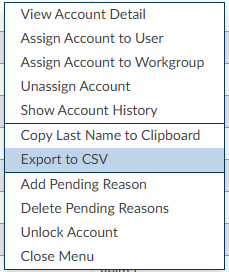
Export to CSV
Search results can be exportd from the right click menu. Exporting in the CSV format allows users to view them in Excel. Exported results will maintain the columns and grouping.
Calendar View
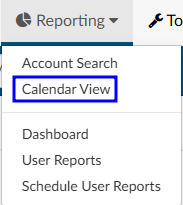
The calendar view will show which users touched charts on a specific day and the actions they took. Upon first
logging on, users will be presented with a calendar view. By default, the view shows the current calendar week.
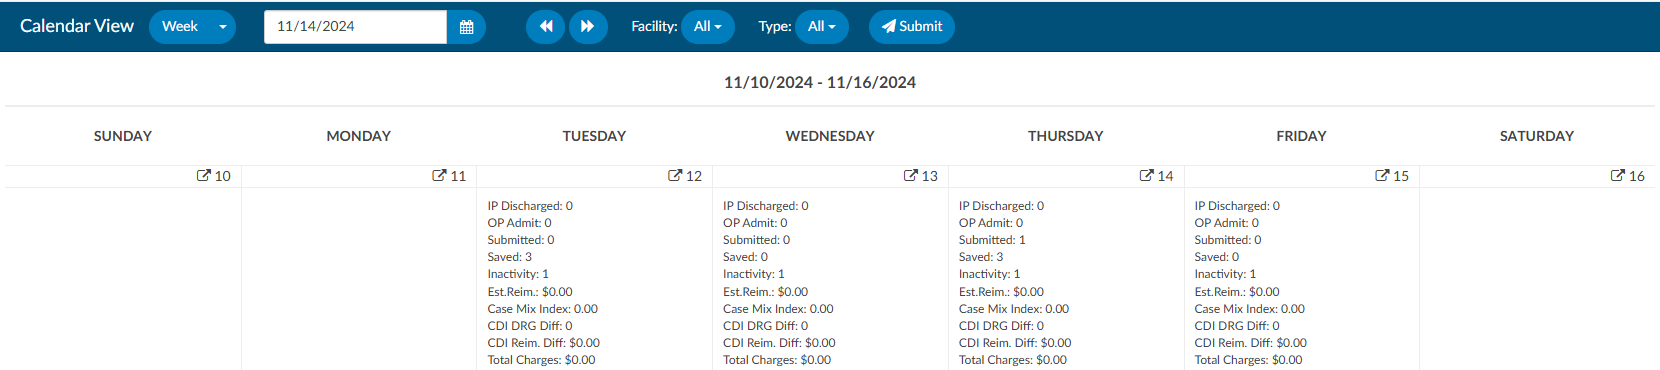
To view the entire calendar month or choose a date range use the control keys at the top of the calendar.

The left and right buttons located at the right of the date field will allow you to change the month
forward or backward one month per click. Each of the calendar days have information provided which
are defined below. The facility drop down menu, will allow the user to select a facility (if applicable). The type drop down menu, will allow the user to select a patient type (category) (if applicable). Once the parameters havee been defined, click Submit to display the data within the calendar.
Statistics
Each Calendar date has its own overview statistics. The numbers and totals shown on the calendar are
distinct numbers, meaning each chart is only considered once per each category below even if a
user clicked save or submit multiple times it will be ONLY counted once.
| Statistic | Description |
|---|
| IP Discharged | This is a total inpatient chart that received a discharge date of the date you are viewing on the calendar. |
| OP Admit | This is a total outpatient chart that received an admit date of the date you are viewing on the calendar. |
| Submitted | This is the total number of charts that the user clicked the submit button. This is a distinct number of submits which means that each chart even if a user clicked submit multiple times it will be ONLY counted once. |
| Saved | This is the total number of charts that the user clicked the save button. This is a distinct number of submits which means that each chart even if a user clicked save multiple times it will be ONLY counted once. |
| Inactivity | This is an account that was saved automatically due to inactivity (session timeout). |
| Est. Reim. | This is the total number of charts that the user has clicked the submit button that resulted in the encoder sending an estimated reimbursement, commonly this only occurs on inpatient charts when a DRG is calculated. |
| Case Mix Index | This is the total number of charts that the user has clicked the submit button, commonly this only occurs on inpatient charts when a DRG is calculated. |
| CDI DRG Diff | This is the total number of charts that resulted in a difference in DRG from CDI to Coding. |
| CDI Reim Diff | This is the reimbursement difference of charts that resulted in a difference in DRG from CDI to Coding. This number will not populate if you do not have the reimbursement coming back from the encoder with the DRG. |
| Total Charges | This is the total charges from the charts that the submit button was clicked on. |
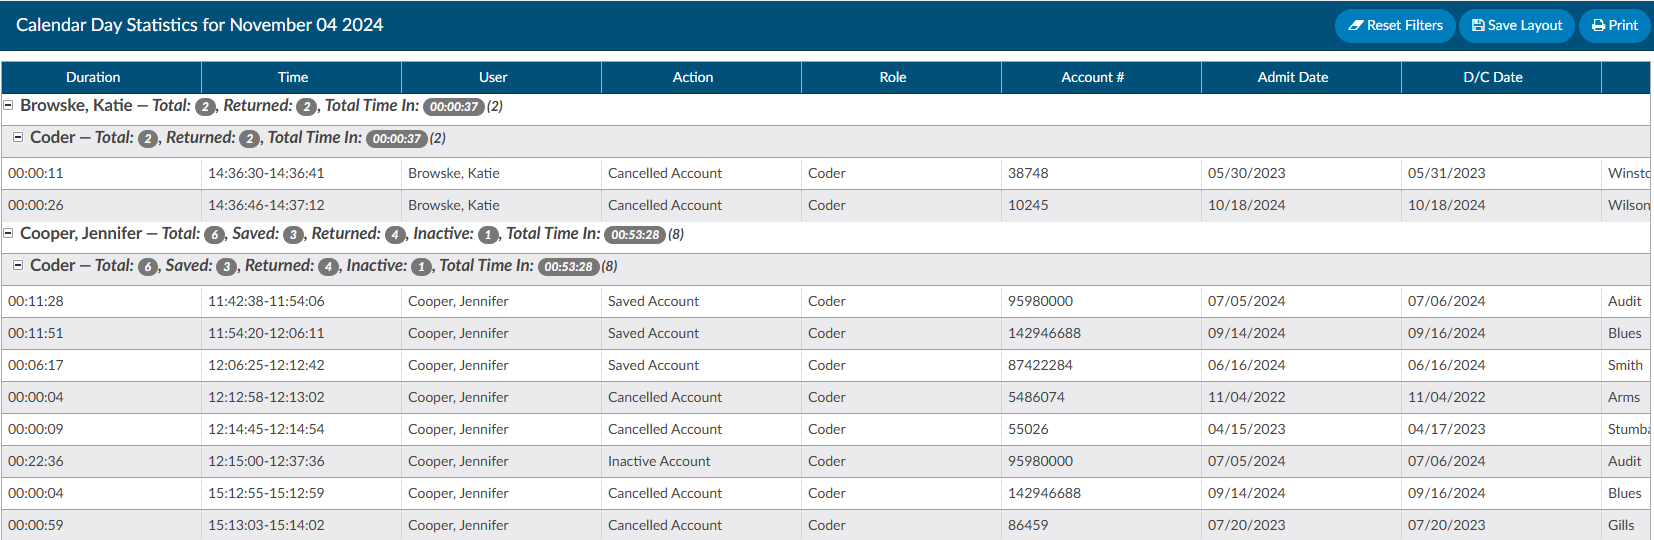
To review the details surrounding a calendar date, click on the square with an arrow next to the calendar
date. This will display the calendar day statistics making up the overview data.

Calendar Day Statistics
All counts on the grouping row of the Calendar Stats by Day page are based on distinct accounts.
Categories will be hidden if they have a count of zero. The information grid below the total sum will be
an audit trail and will not add up to the grouping counts.
| Field | Description |
|---|
| Submitted | Submitted is a term used to mean the chart was completed by coding. This also means that the code packet including patient demographics, code data, and abstraction fields have been passed to the abstraction system to be finalized. |
| Resubmitted | Resubmitted is a term used to mean the chart was completed by coding and the chart had already had a submit action performed. This also means that the code packet including patient demographics, code data, and abstraction fields have been passed to the abstraction system to be finalized. |
| Saved Account | Saved is a term used to mean the chart was not completed by coding. A user may save a chart if there was missing documents, query or the user could not complete the chart at the time of coding. |
| Inactivity | Inactivity is a term used to mean the chart was saved automatically due to inactivity (session timeout). |
| Canceled Account | Canceled is a term used to mean the chart was opened, nothing was changed on the account, and it was returned to the queue to be coded by another user. |
View Account Codes
To view an account, right click on any of the grid rows. This will display codes assigned to this account.
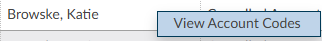
This view provides a look at codes that were assigned by Coders and/or CDI. Not all charts will have both user views. Available views will depend on if the chart opened yields information from one or both user types. This view will indicate the state of chart for the audit item selected.
The columns listed below are default, however a user can change this display by hovering over a grid field and selecting the 3 horizontal lines.
| Column Name | Description |
|---|
| Duration | This field provides the total time that a user entered into the account displayed to the right of this field this will display in HH:MM:SS. |
| Time | This field provides the time that a user entered into the account displayed to the right of this field. |
| User | This is the person who performed the action. |
| Account # | This is the account # of the patient chart the user reviewed. |
| Action | This is the action the user did. An action being submit, resubmit, cancel or save. |
| MRN | This is the MRN of the patient chart the user reviewed. |
| Patient Name | This is the patient name of the patient chart the user reviewed. |
| Status | Submitted – The chart has been sent outbound to a downsteam system (abstraction or billing) Unbilled – The chart has not yet been submitted yet. QA - The system had workflow that placed this chart into QA, there are many reasons please consult your workflow manual. |
| Admit Date | This is the admit date of the patient chart. |
| Discharge Date | This is the discharge date of the patient chart. |
| LOS | This is the LOS the CAC system calculated based on the admit and discharge date of the patient chart. |
| Category | This is the patient type of the patient chart. |
| Facility | This is the facility of the patient chart. |
User Reports
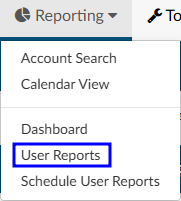
User reports are canned reports that are preformatted. User reports were created to be run on-demand, but many reports can also be scheduled to run at a specific date/time interval. Each report is outlined below along with a brief description.
Users looking for data that is not available in user reports can use account search to create custom searches and then export the raw data.
Running a User Report
- Select the report from the available list - the selected report will display a short description on the screen
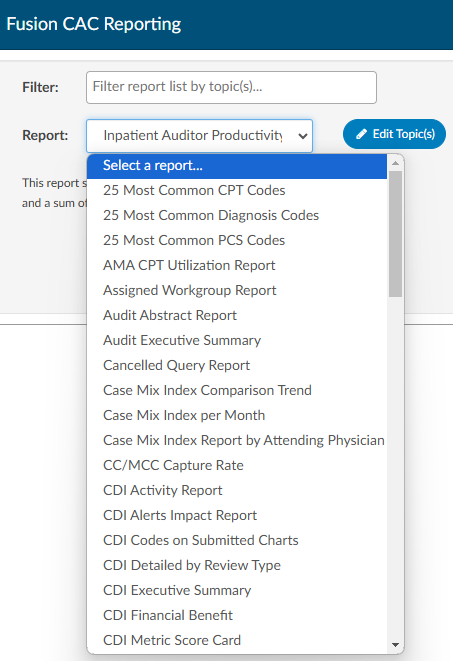
- Filter as needed - each report is unique in the style of data it will yield. Review filter options and use as needed.
CDI Filters
Most CDI reports contain additional filters to give the user the option to filter as ‘
include’ or ‘exclude’
- Select the format of the report - .xlsx will result in a file in the users downloads folder.

- Select Run Report

User Reports and Descriptions
The following is a complete list of Fusion CAC’s default reports and their descriptions. An organization may have custom reports
that do not appear in this list. Additionally, some reports may be part of an add-on module. For questions or if there are other reports your organization would benefit from and you cannot pull the data you need from account search please contact our SME Team (smeteam@dolbey.com) to discuss options.
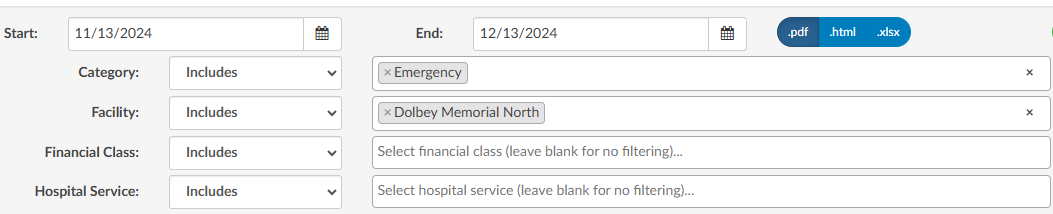
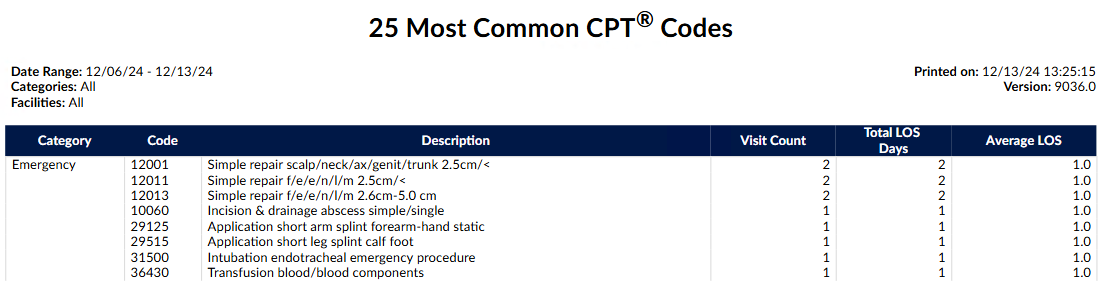
25 Most Common CPT Codes Report
This report is to provide a listing of the top 25 CPT® codes by patient type (category) for the discharge
date range provided. The Date Range for this report is the Chart Discharged Date.
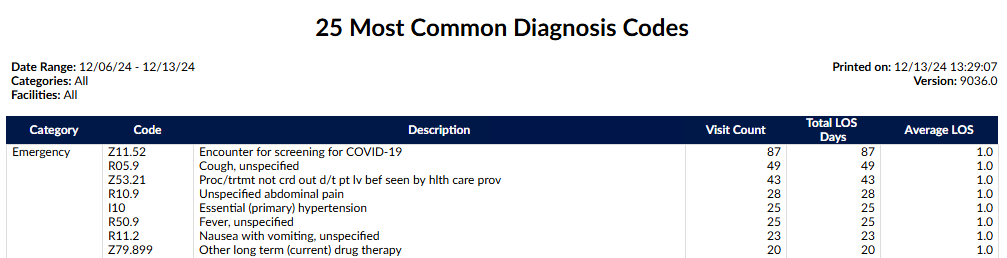
25 Most Common Diagnosis Codes Report
This report is to provide a listing of the top 25 diagnosis codes by patient type (category) per the
discharge date range provided. The Date Range for this report is the Chart Discharged Date.
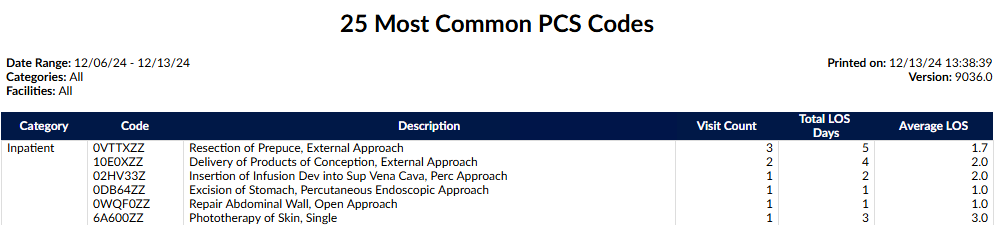
25 Most Common PCS Codes Report
This report is to provide a listing of the top 25 PCS codes by patient type (category) per the discharge
date range provided. The Date Range for this report is the Chart Discharged Date.
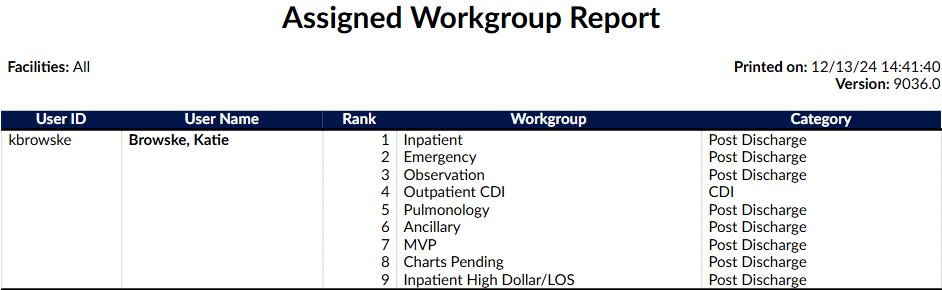
Assigned Workgroup Report
This report provides details about each of the users and what workgroup they are assigned to in
sequence. The date range input is irrelevant for this report and will always display the user’s current
workgroups.
Date Criteria Ignored
Date criteria are not used for this report. The user’s current workgroup assignments are reported.
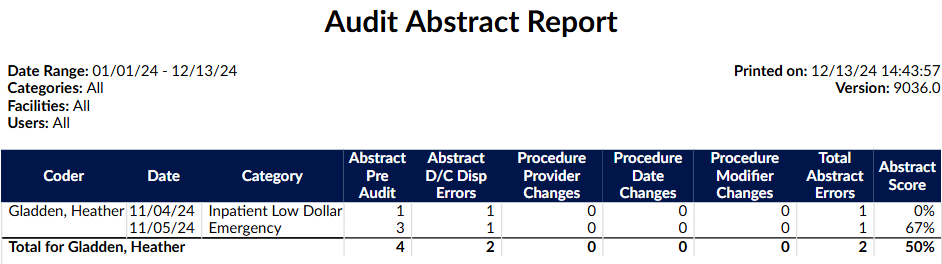
Audit Abstract Report
This report will provide an overview of the abstraction scores for each user based upon a date range.
Notes:
- Abstract Pre-Audit value is the total number of abstraction items (discharge disposition change, date changes and provider changes) added pre-audit.
- Abstract D/C Disp Errors value is the total number of discharge disposition errors.
- Procedure Provider Changes value is the total number of procedure provider changes (PCS and/or CPT).
- Procedure Date Changes value is the total number of procedure date changes (PCS and/or CPT).
- Procedure Modifier Changes value is the total number of procedure modifier changes (CPT).
- Total Abstract Errors value is the Sum of all abstract (discharge disposition change, date changes and provider changes) errors during audit.
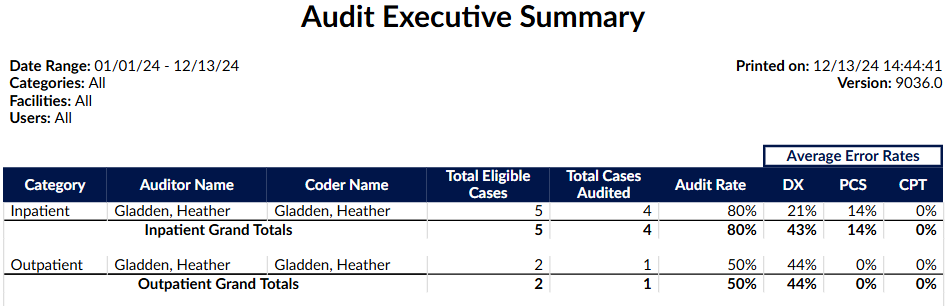
Audit Executive Summary
This report is an executive level view that shows an overview of inpatient and outpatient audit activity
by Auditor. It includes the audit rate and average error rates for diagnoses and procedure coding. The
date of this report is based on the date the account was first submitted.
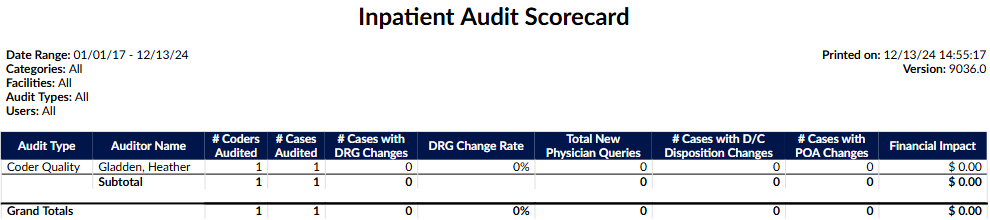
Inpatient Audit Scorecard
This monthly report provides a summary of the Auditor’s work completed for any type of inpatient audit
and the financial impact based on the audit findings. This report will show number of coders and coded
encounters audited that resulted in a DRG change and either over payments or under payments. This
report will also show the details of physician queries that resulted because of the audit and financial
impact of changes made.
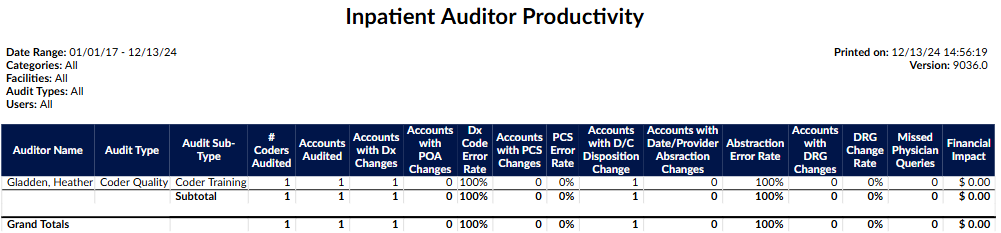
Inpatient Auditor Productivity
This report shows auditor productivity by audit type and sub-type and a sum of the total outcomes for
each.
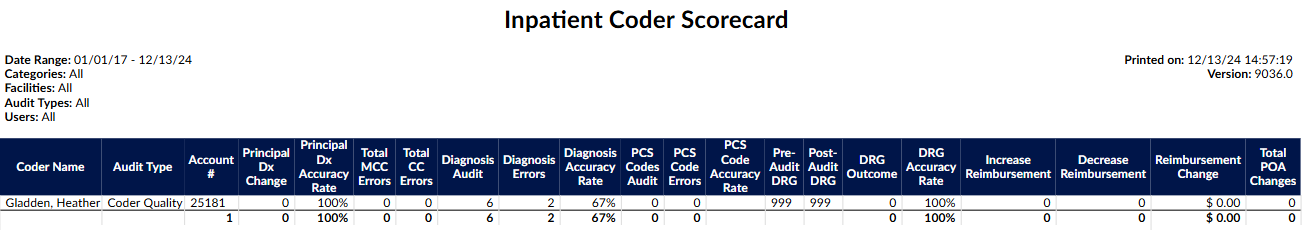
Inpatient Coder Scorecard
This report shows, on an individual coder basis, the principal diagnoses, secondary diagnoses, and
procedure code assignment errors that may or may not have resulted in a DRG change and financial
impact. The report has an audit present. The date range for this report is for the date the audit was
performed.
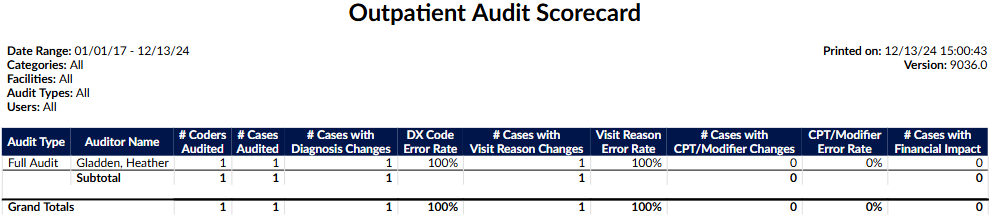
Outpatient Audit Scorecard
This monthly report provides a summary of the Auditor’s work completed for any type of outpatient
audit.
Outpatient Auditor Productivity
This report shows auditor productivity by outpatient audit type and sub-type and a sum of the total
outcomes for each.
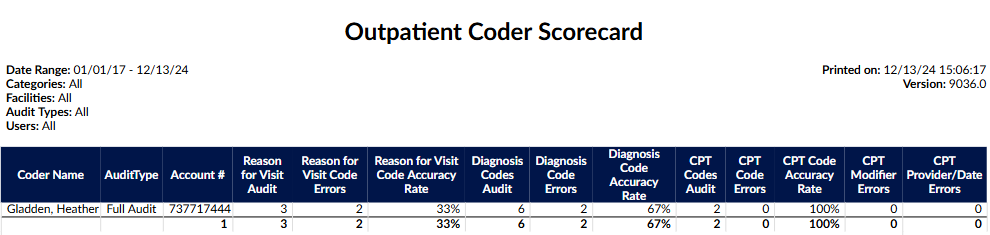
Outpatient Coder Scorecard
This report shows, on an individual coder basis, the errors and accuracy rates for diagnosis codes
including Reason for Visit and secondary diagnoses; errors in CPT code assignments, modifiers, charges,
and procedure details (provider name and date of procedure). The date range for this report is for the
date the audit was performed.
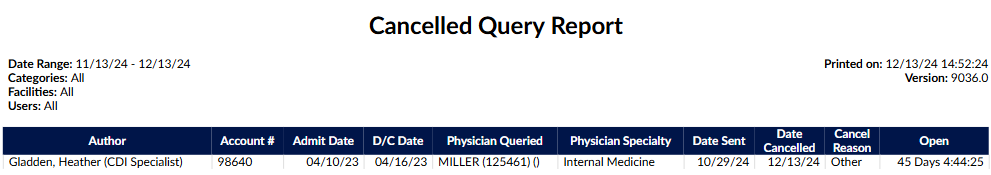
Cancelled Query Report
This report is to track Physician Queries that were cancelled within the date range specified. Only
queries cancelled from within the Physician Query viewer will be tracked on this report, i.e. any third-
party cancellations will not appear. Created date and cancelled date will be displayed, along with the
amount of time the query was open. The date range for this report is the date that the physician query
was cancelled.
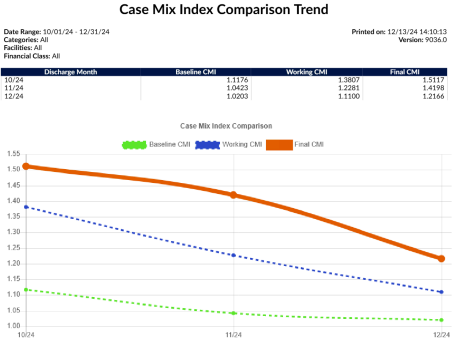
Case Mix Index Comparison Trend Report
This report shows the Baseline, Working, and Final CMI per discharge month. (Filtering: Only run as a
monthly report). The date range on this report is the Chart Discharge Date please note the range is
expanded to the full month.
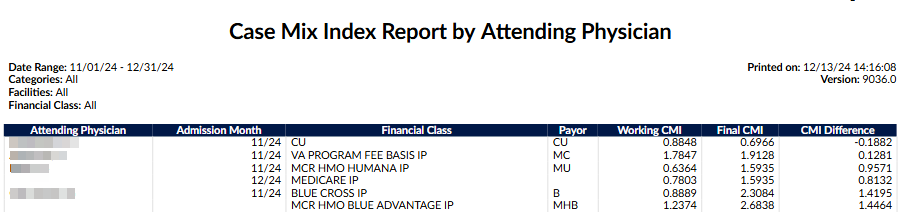
Case Mix Index Report by Attending Physician Report
This report will show the difference between the most Current Working CMI and Final CMI, additionally
providing the CMI Difference (Final CMI – Current Working CMI.) This report will show how the
physician’s documentation impacted the chart over the course of the patient’s stay. If the physician
documented appropriately, the Current Working and Final DRG should be very close. If the DRGs are far
apart, the likely cause is that either the CDI did not have the documentation, or the physician did not
document the chart comprehensively. This report should be used in conjunction with additional auditing
on the attending physician if you are questioning the results. (Filtering: Only run as a monthly report).
The date range for this report is on the Chart Admit Date
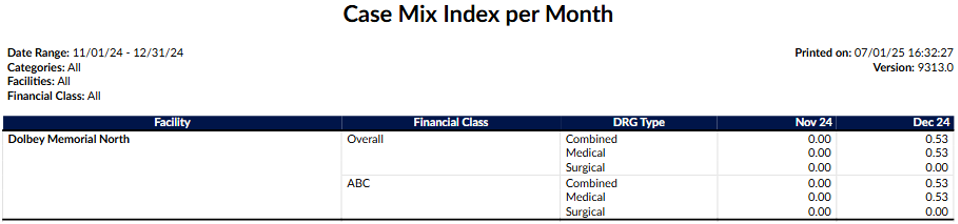
Case Mix Index per Month
Date Range: Chart Discharge Date (only Submitted Inpatient charts with a DRG Weight valued will
appear in this report)
This report will provide a monthly case mix overall for all financial classes then for each financial class.
This report is based upon final coded outcomes. A “case mix index” is the average DRG Weight of
accounts that have a DRG Weight - This report only includes submitted inpatient accounts with a DRG
Weight.
Total Groups
Totals are displayed differently based on the facility filter and the number of facilities
returned by the report.
- If there is no filter on facility and more than one facility is in the report, an additional “All Facilities”
group is appended that calculates the case mix for each financial class across all facilities.
- If there is any filter on facility and more than one facility is included in the report, an additional “Combined
Facilities” group is appended that calculates the case mix index for each financial class across
the filtered facilities.
- If only one facility appears in the report, there is no “All Facilities” or “Combined Facilities” group.
Blank Field Values
Blank facilities or financial classes are displayed as an empty string to be consistent with other reports.
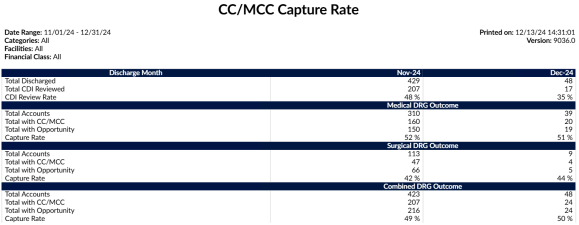
CC/MCC Capture Rate
This report provides the final outcome of CC/MCC capture rate. This can be used to compare the
CC/MCC capture rate to those DRG’s that don’t have a DRG but, have the opportunity to be maximized
which is defined as DRG’s with a DRG description of without CC/MCC, w/o CC, w/o MCC. This report will
tell you what opportunities may have been missed
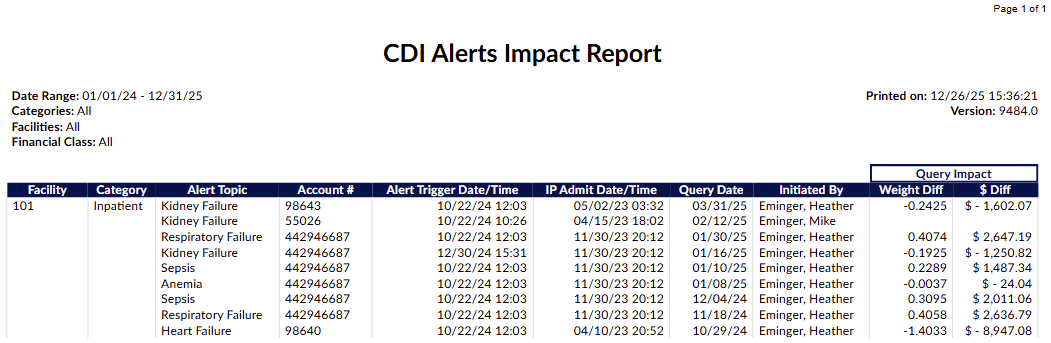
CDI Alerts Impact Report
This report allows the user to see what the overall impact on CDI Alerts. It gives the user insight on how impactful the CDI Alert was. It will allow user to see not only if the Alerts are having an impact, but also how much benefit the Alert was. It also shows us which Alerts may be having little to no impact and may need to be adjusted accordingly.
CDI Alerts Required
CDI Alerts must be implemented to use this report. The date range is based on the admite date of the chart, which must be inpatient and have MatchedCriteriaGroups validated CDI Alerts.
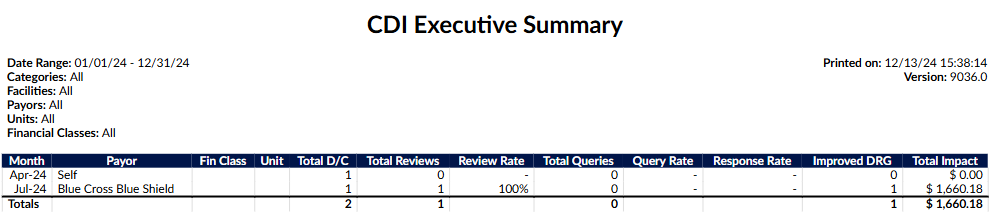
CDI Executive Summary Report
This report is an executive level view broken down per month that shows total discharges vs. total
reviews in addition to the # of total queries, response rates and improved DRG’s. The improved DRG is
calculated by determining if there was a positive reimbursement gain from the baseline to the working
DRG. (Filtering: Max of 12 months selected; only run as a monthly report). The date range on this report
is the Chart Admit Date, please note that this report date range is expanded to the full month
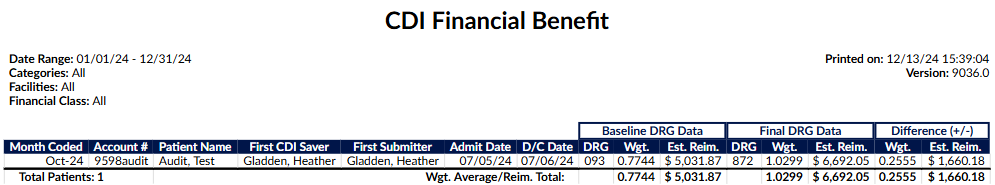
CDI Financial Benefit Report
This report is broken down per month coded and the total financial impact CDI had on the chart. The
report will only display charts with unmatched DRG’s and show a financial impact based on the baseline
DRG to final coded DRG. The date range on this report is the Chart Submitted Date (LastSubmitter).
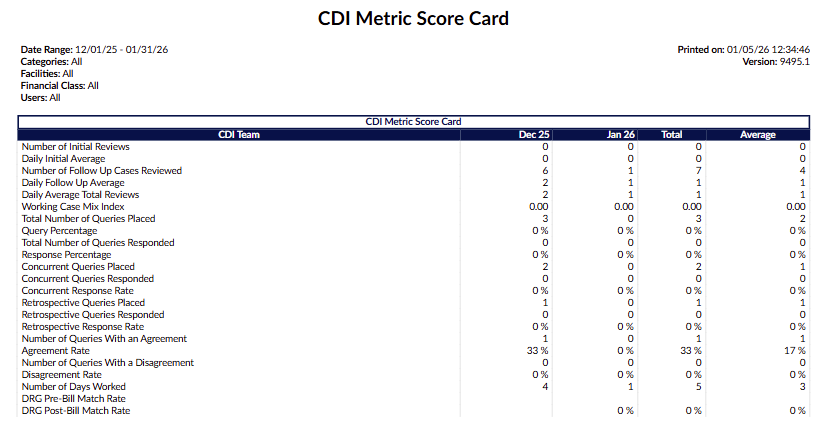
CDI Metric Score Card
This report shows CDI productivity based upon the CDI user reviews and queries. The report will show
CDI activity specifically on the number of initial reviews (first time a CDI reviews a chart), number of
follow up reviews (reviews beyond the first time a CDI reviews a chart), queries issued, agreed upon
query amounts, and the number of days we show activity occurring. The Total column calculates the combined statistics for all months within the report. By comparison, the Average column calculates the average statistics per month within the report.
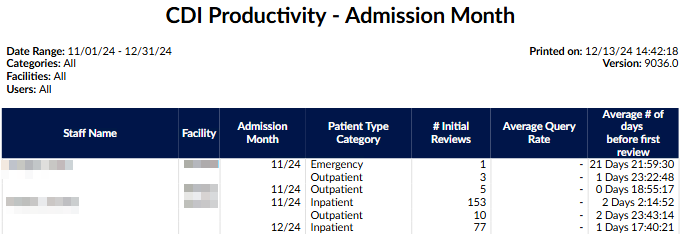
CDI Productivity - Admission Month Report
This report shows CDI productivity based upon the admission month of the patient. The report will show
CDI activity specifically on the # of initial reviews (first time a CDI reviews a chart). A review is calculated
by the following:
- Inpatient: First time a user with a role of CDI computed a Working DRG and saved the chart.
- Outpatient: First time a user with a role of CDI saved the chart.
This report will also tell you out of the charts the CDI staff member completed what the query rate is
and on average how many days did it take before the chart was initially reviewed. Reporting is done on
the admission month, so this report displays any patient discharged or not discharged during this
admission month if there was a CDI review. (Filtering: Only run as a monthly report). The date range on
this report is the Chart Admit Date, please note that this report date range is expanded to the full
month.
CDI Query Detail Report
This report provides details of physician queries created by CDI Specialists on accounts that have since
been discharged. This report details how the account evolved from a Baseline DRG to a Final DRG.
No PDF Support
Due to the number of columns, this report is not intended to be launched as a PDF.
Any non-canceled physician query created by a CDI Specialist on an inpatient, now-discharged account
should appear as a line item on this report.

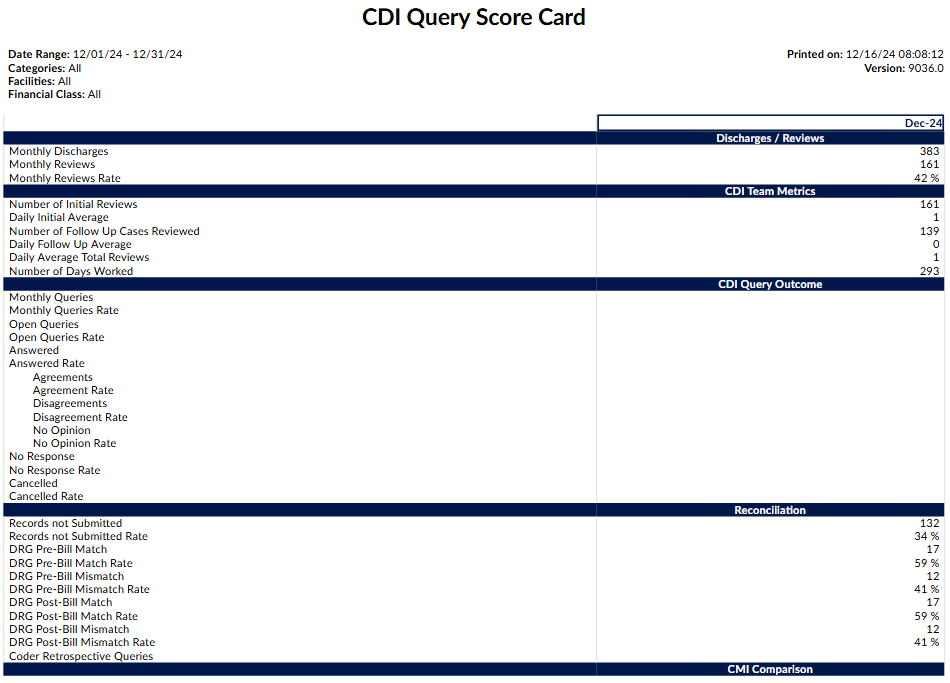
CDI Query Score Card Report
This report is displayed in several sections:
- Discharge/Reviews – This section reports on the review rate of the CDI team. It displays
the number of patients discharged in the current month along with how many of them
were reviewed by CDI.
- CDI Query Outcome – Of the charts that made up the review rate under discharges, this
section displays the total that resulted in queries that are broken down more granularly
by the physician’s response rate.
- Reconciliation – This section displays charts that created the review rate section and
have a final DRG without having a submitted status. This section shows how often CDI
and coders agree on the DRG.
- CMI Comparison – This section reviews where the chart started (Baseline DRG CMI) and
where the chart ended up (Final DRG CMI – which is the reported CMI). (Filtering: Max
of 12 months selected; only run as a monthly report).
- CDI Team Metrics - The calculations within these sections are like the existing fields in the
CDI Metric Score Card report, but the review counts are determined by the discharge date or
admit date of accounts, respectively
The date range on this report is the Chart Discharged Date, please note that this report date range is
expanded to the full month
CDI Query Score Card by Admission Month
This report is displayed in 4 sections:
- Admit/Reviews – This section reports on the review rate of the CDI team. It displays the number of patients admitted in the current month along with how many of them were reviewed by CDI.
- CDI Query Outcome – Of the charts that made up the review rate under admits, this section displays the total that resulted in queries that are broken down more granularly by the physician’s response rate.
- Reconciliation – This section displays charts that created the review rate section and have a final DRG without having a submitted status. This section shows how often CDI and coders agree on the DRG.
- CMI Comparison – This section reviews where the chart started (Baseline DRG CMI) and where the chart ended up (Final DRG CMI – which is the reported CMI).
(Filtering: Max of 12 months selected; only run as a monthly report).
Calculations
- Daily Initial Average is simple math of two other values to get the average number of initial reviews per day:
- Daily Initial Average = (Number of Initial Reviews) / (Number of Days Worked) - rounded to whole number
- Daily Follow Up Average is similar:
- Daily Follow Up Average = (Number of Followup Reviews) / (Number of Days Worked) - rounded to whole number
- Daily Average Total Reviews is simply adding both averages:
- Daily Average Total Reviews = (Daily Initial Average) + (Daily Follow Up Average) - rounded to whole number
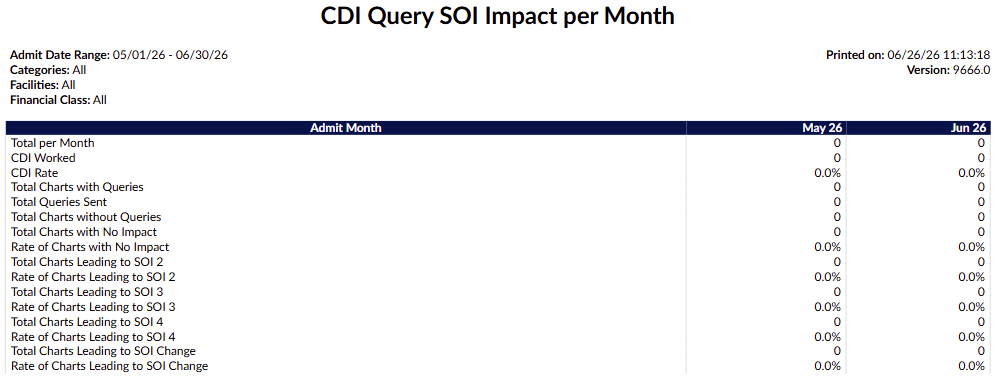
CDI Query SOI Impact per Month
This report provides CDI teams with a monthly view of query activity and the resulting impact on patient SOI for submitted inpatient accounts. It tracks accounts where a CDI Specialist established a Baseline APR-DRG and a Coder’s Final APR-DRG reflected a higher SOI, allowing teams to monitor documentation improvement trends and measure the effectiveness of their query practices. Users can filter results by either Admit Date or Discharge Date, with a maximum range of 12 months. When exported to Excel, the report includes four tabs; a cover sheet, a details tab, a summary, and a bar chart visualization; while PDF and HTML exports display the summary only.
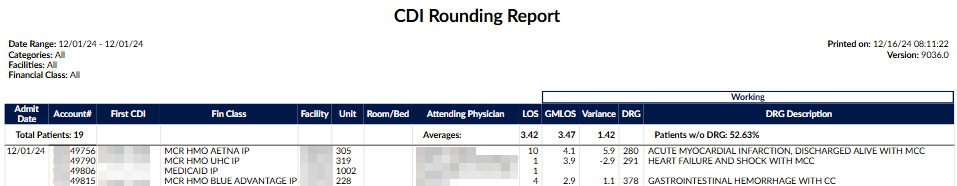
CDI Rounding Report
This report shows all charts reviewed and not reviewed by CDI. If the account has not been reviewed by
CDI, working information will be blank to allow CDI to take notes while rounding. If the account has been
reviewed by CDI, this report will show an account level view by admit date of the difference between
the ALOS and the GMLOS based on the most current Working DRG. The variance is the difference
between ALOS and the GMLOS. The higher that number, the chart is identified as needing a re-review
for potential DRG change and SOI/ROM. The date range on this report is the Chart Admit Date. To
qualify for this report the chart must be an Inpatient Chart.
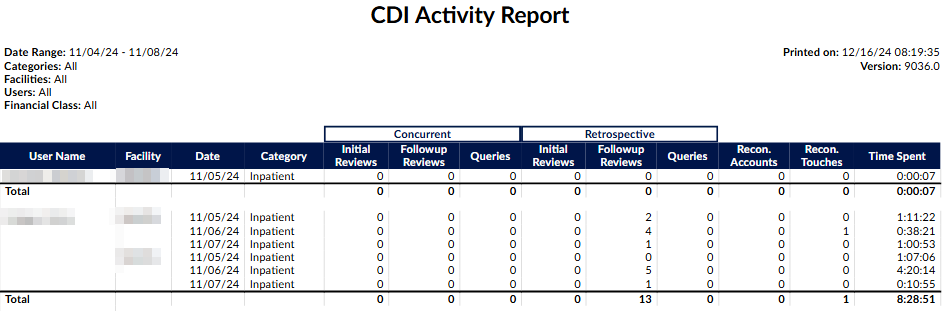
CDI Activity Report
This report shows the number of ‘Initial Reviews’ vs ‘Followup Reviews’ per category (patient type) with
the total number of queries sent. (Filtering: Max of 31 days selected). The date range on this report is
the Chart Working DRG Save Date/Time (Query Create Date for the Queries.)
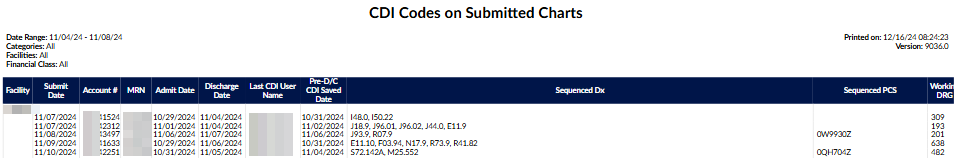
CDI Codes on Submitted Charts Report
This report shows the list of diagnosis codes and procedures that CDI assigned in sequenced order.
No PDF Support
Due to the number of columns, this report is not intended to be launched as a PDF.
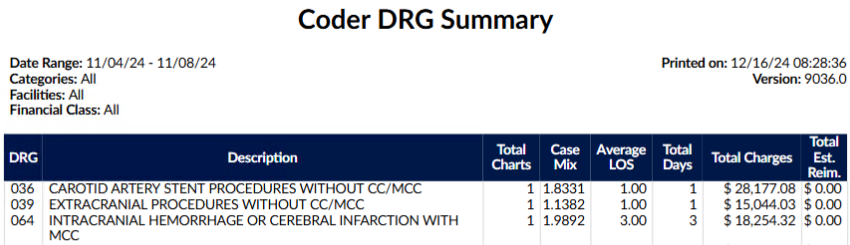
Coder DRG Summary
This report is to show the breakdown per coder MS-DRG to show the total visits per DRG.
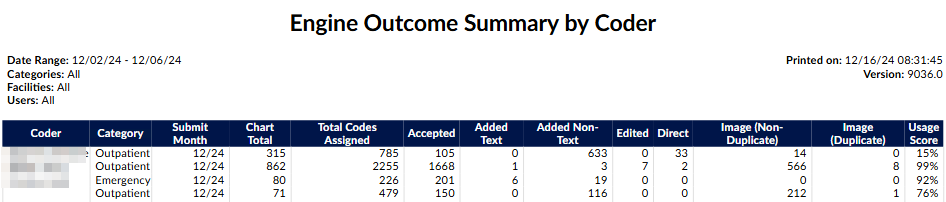
Engine Outcome Summary by Coder Report
This report can be used to determine how the engine performed for the coder. It shows whether they
leveraged the code suggestions or if they manually entered codes, bypassing suggestions. Data is
gathered based on the date the chart was coded, and is based on final codes, not working. This report
should be used in conjunction with a coding audit if needed.
- Accepted: A code suggestion was assigned directly to the account.
- Added: A code was added to a text document manually and assigned to the account.
- Added Text: counts the number of codes added to phrases in text documents that were not suggested by FAE.
- Added Non-Text: counts the number of codes added to the top of text documents and worksheets that were not suggested by FAE.
- Edited: A code suggestion was edited and then assigned to the account.
- Direct: A code was assigned directly to the account manually or from the Solventum CRS encoder, but also suggested by FAE
- Image: A code was assigned from an image document.
- Image (Non-Duplicate): counts the number of codes added to image documents not suggested by FAE.
- Image (Duplicate): counts the number of codes added to image documents that were also suggested by FAE.
The date range on this report is the Chart Submitted Date (FirstSubmitter.)
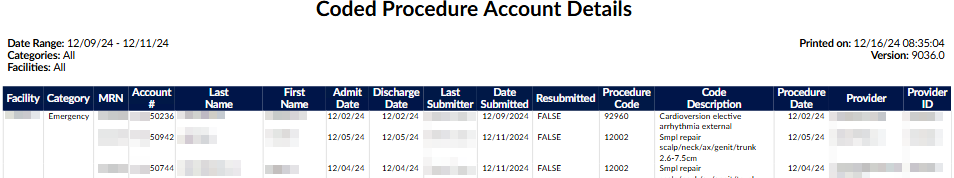
Coded Procedure Account Details Report
This report provides details about charts with assigned procedures. The date range on this report is the
Chart Last Submitted Date. To qualify for this report the chart must have at least one Procedure code
assigned on the chart.
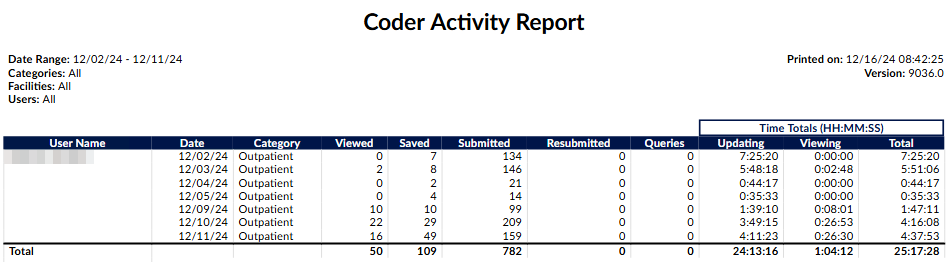
Coder Activity Report
This report shows the distinct number of accounts that were ‘Viewed’, ‘Saved’, ‘Submitted’, and
‘Resubmitted’, then the total number of Queries created, the total time updating, time viewing
accounts, and total time spent per day - grouped by coder then by category (patient type) over the date
range. Date Range is the date of the activity, beginning of start date to the ending of end date. (Filtering:
max of 31 days selected). The date range on this report is the Change History Audit Date (Viewed, Saved,
Submitted, Resubmitted actions.
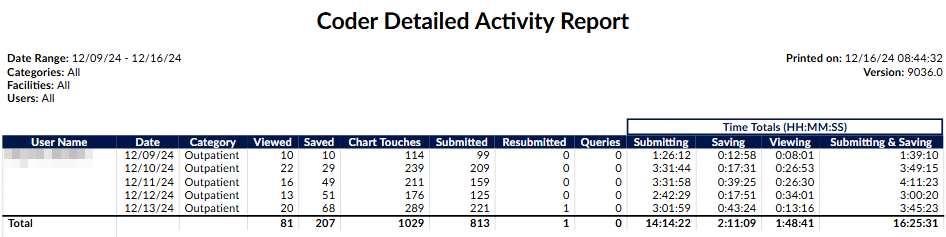
Coder Detailed Activity Report
This report is very similar to the “Coder Activity Report” but with two notable changes:
- The new column “Chart Touches” counts the number of times the user touched" an
account on a specific date. A touch is defined as a unique save or submit action.
- The times submitting and times saving are split. If the user loads an accounts, saves it,
keeps the account loaded, and then submits it, the time between loading the account
and saving it counts as time submitted instead of time saving.
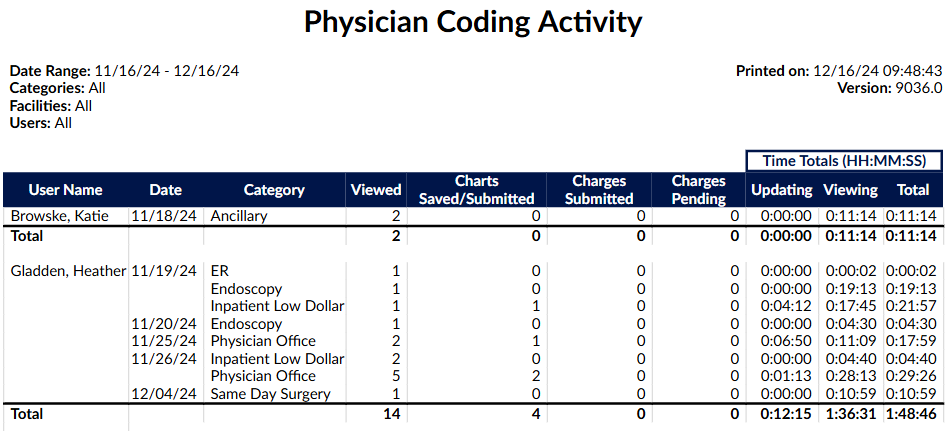
Physician Coding Activity
This report shows the distinct unique charts a physician coder viewed and how many changes were
submitted and pended, then the total number of Queries created, the total time updating, time viewing
accounts, and total time spent per day - grouped by coder then by category over the date range. Date
Range is the date of the activity, beginning of start date to the ending of end date.
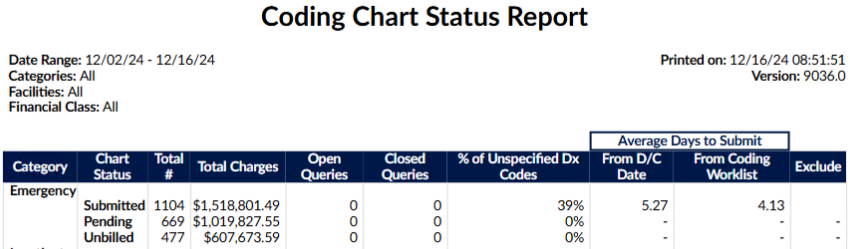
Coding Chart Status Report
This report displays coding productivity in regard to submitted, pending, and unbilled charts. This report
shows how long the chart took to code from the time the patient was discharged and how long the chart
took from the time the coder had accessibility to the patient chart. Once a patient is discharged, it may
be examined for completeness and non-coding staff may place pending reasons on the chart to indicate
deficiencies. When the deficiencies are resolved, the chart is then assigned to a coding worklist to
indicate the chart is ready for coding. The date range on this report is the Chart Discharged Date
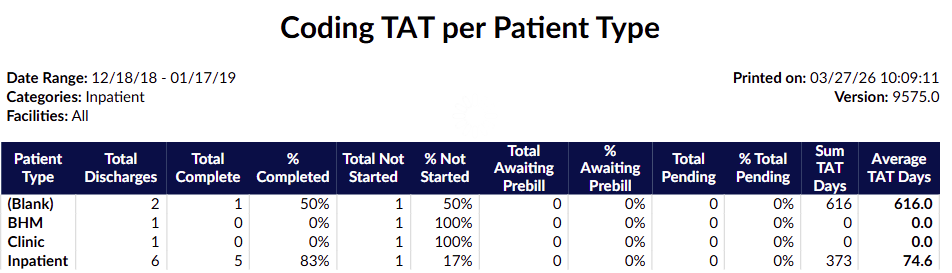
Coding TAT per Patient Type
This report displays coding productivity in regard to submitted, pending, and unbilled charts. This report shows how long the chart took to code from the time the patient was discharged and how long the chart took from the time the coder had accessibility to the patient chart. Once a patient is discharged, it may be examined for completeness and non-coding staff may place pending reasons on the chart to indicate deficiencies. When the deficiencies are resolved, the chart is then assigned to a coding worklist to indicate the chart is ready for coding.
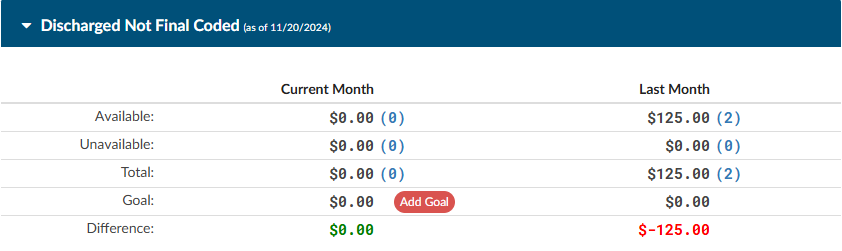
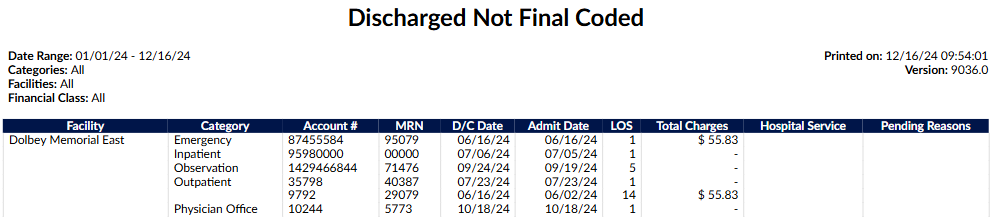
Discharged Not Final Coded Report
This report will show management all of the discharged charts within the system that do not have final
coding. The date range for this report is the Chart Discharged Date. To qualify for this report the chart
must have a status of Unbilled. If there are multiple pending reasons on a qualifying chart, they will be
separated by a comma.
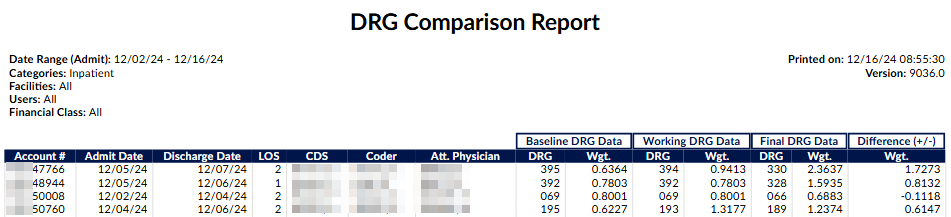
DRG Comparison Report
This report shows the difference between Baseline DRG and Final DRG per account. Only accounts that
have both a CDS calculated Baseline DRG and a Coder Submitted Final DRG with an Admit Date within
the selected range will be included. The user(s) selected below will constrain the data to either (or both)
by the CDS on the most current calculated Baseline DRG or the Coder that last submitted with a Final
DRG. (Filtering: Minimum of 1 category selected). The date range on this report is the Chart Admit Date.
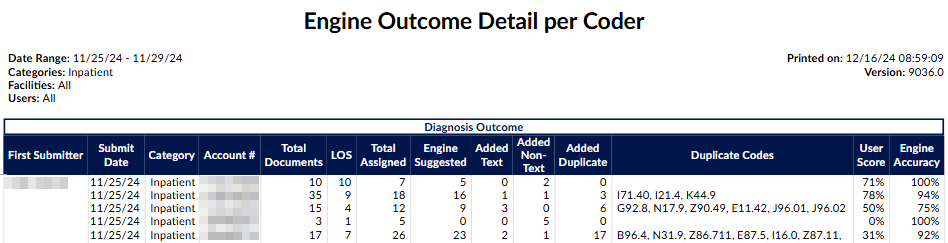
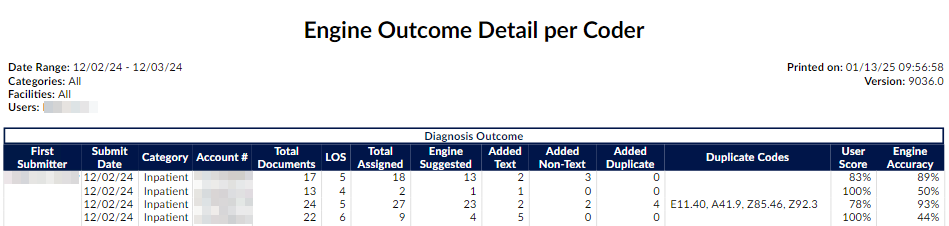
Engine Outcome Detail per Coder
This report should be used to show if the user is using code suggestions or manually adding codes. It will
show total assigned codes broken down by code set along with how many codes were suggested by the
engine versus added by text documents and non-text documents in addition to those that were added in
duplicate. This report card should be used as an educational opportunity to show possible
improvements for the end-user and/or code suggestions. This report is recommended to be used in
conjunction with an audit.
Documents without codes not included in total
The field “Total Documents” had to be constrained to count the total documents on the account with at
least one attached code to make the formulas correct. Documents with no codes (suggested nor added) are
not counted in this report (and shouldn’t be since this report is about engine outcome).
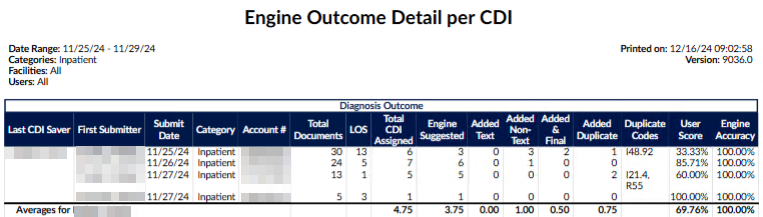
Engine Outcome Detail per CDI
This report shows the total codes that the engine is suggesting, and what CDI is using vs. what CDI is
manually adding compared to the coder’s Final Codes. This report should tell the level of manual effort
per CDI of those codes that are being used for final code assignment by coders. It will show total
assigned codes by CDI broken down by code set along with how many codes were suggested by the
engine versus added by text documents and non-text documents in addition to those that were added in
duplicate. There is also a column to indicate of the codes manually added how many did the coder
assign for final code assignment. This report card should be used as an educational opportunity to show
possible improvements for the end-user and/or the code suggestions. This report is recommended to be
used in conjunction with an audit.
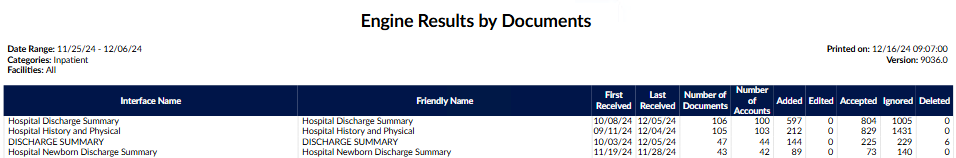
Engine Results by Documents Report
This report shows the default engine accuracy per document at the time of submission. Also, shows the
first and last times the document was received on the submitted accounts. The report is sorted from
most to least added/edited codes by the coder. The date range on this report is the Chart Submitted
Date (FirstSubmitter).
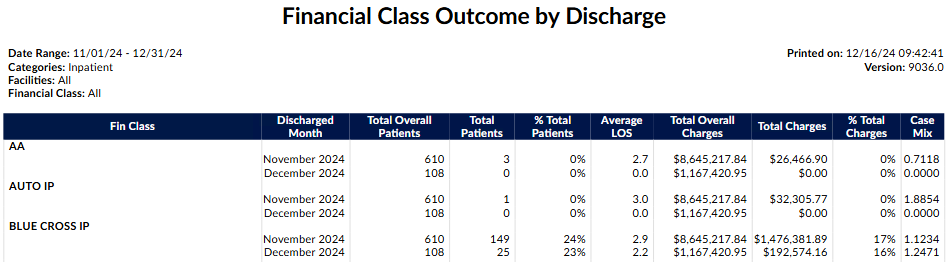
Financial Class Outcome by Discharge Report
This report shows the breakdown per financial class per month. It will breakdown the total patient
charts, average length of stay total charts and case mix index.
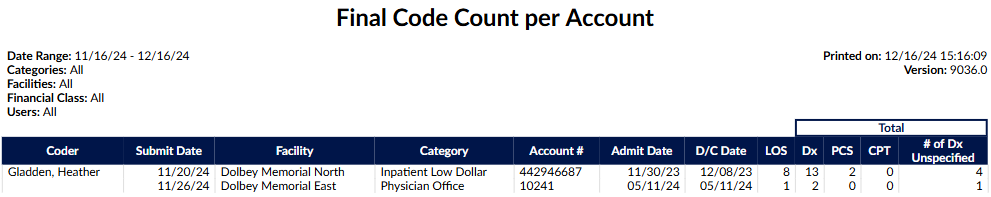
Final Code Count per Account Report
This report shows the submitted chart high level outcomes for diagnosis and procedure codes per
account. The Total Dx column displays the total of unique diagnosis codes on the account (visit, admit,
principal and secondary); the # of DX Unspecified column shows how many of those codes are showing
an ‘unspecified’ designation in their description. This report will allow managers to target coder audits to
determine if the chart is being coded correctly or if additional data should have been requested through
a query. This report would be used in conjunction with an audit. The date range on this report is the
Chart Last Submitted Date (Must have a status of Submitted.)
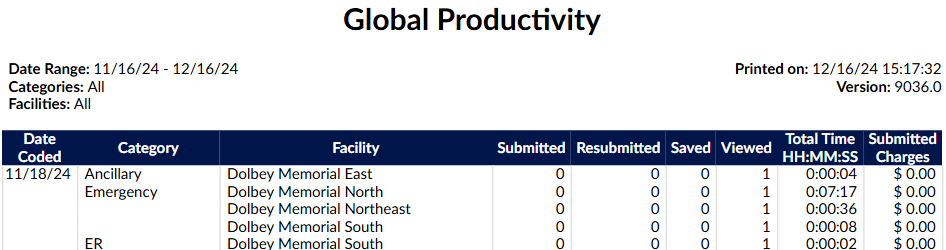
Global Productivity Report
This report shows coder productivity by patient type per day, the number of ‘Viewed’, ‘Saved’, and
‘Submitted’ actions, and the total time logged working on that patient type. (Filtering: Max of 31 days
selected). The date range on this report is the Change History Audit Date (Submitted, Resubmitted,
Saved, Viewed actions.)
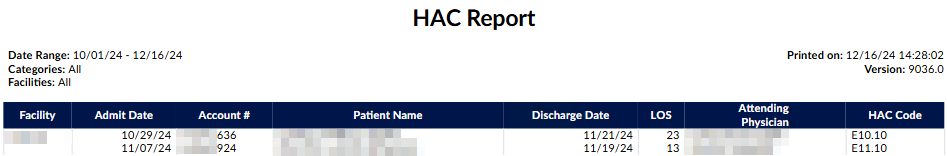
HAC Report
This report is to provide a listing of all patients admitted within the date range of this report that
contains hospital acquired conditions. This report only looks at final coded data and does not reflect
working data. The date range on this report is the Chart Admit Date.
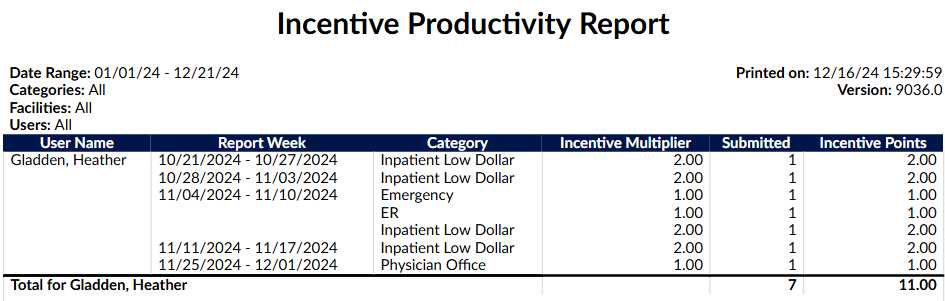
Incentive Productiviy Report
This report applies an incentive multiplier to the distinct number of accounts that were first submitted
each week, per user, to calculate incentive points.
- Multiplies the number of first submitted accounts per week by an incentive multiplier per category that is configured in Mappings Configuration.
- The administrator can optionally record an incentive multiplier that is used in this report.
- Categories without a value in the incentive multiplier will be calculated with an incentive multiplier of 1.0.
- This report is like the “Weekly Coder Productivity Report” in that it reports on whole weeks, but only produces an entry if the coder first submitted an account that week.
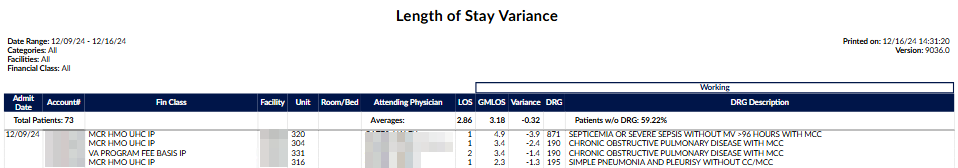
Length of Stay Variance Report
This report shows an account level view by admit date of the difference between the ALOS and the
GMLOS based on the most current Working DRG. The variance is the difference between ALOS and the
GMLOS. The higher that number, the chart is identified as needing a re-review for potential DRG change
and SOI/ROM. The date range on this report is the Chart Admit Date (Must be an Inpatient Chart).
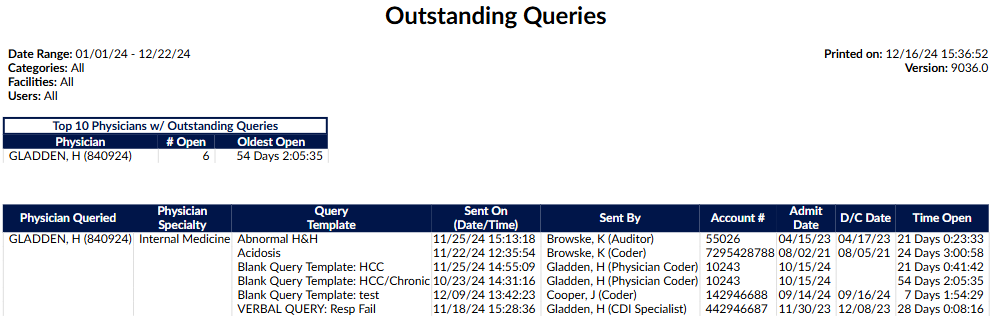
Outstanding Queries Report
This report displays a list of the physicians that have open queries. At the top of the report there is a
summary that shows the Top Physicians with outstanding queries and the length of time their oldest
query has been open. Date Range: Query Create Date (The date that the query was initially created and
sent).
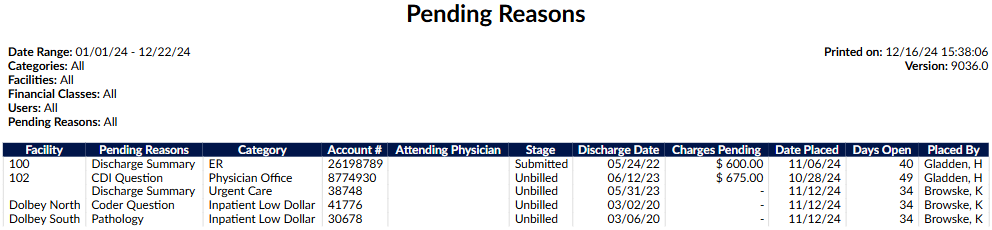
Pending Reasons Report
This report shows which charts are pending, who placed the pending reason, what the pending reason
is, and which physician was assigned to the pending reason. Not all pending reasons will have a
physician assigned as some pending reasons are not a result of chart deficiency. The date range on this
report is the Chart Admit Date.
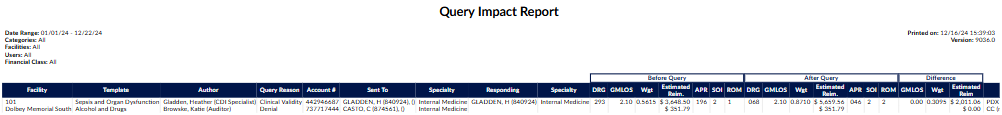
Query Impact Report
This report includes all charts that received queries and resulted in at least one of the following:
- A change in DRG
- Change in CC/MCC/HAC Totals
- Other reasons your facility has defined as a query shift reason
This report will show you the impact that the query made. The report is grouped by query template
name, then by Author, then by account #. The query will also show if there was a shift in DRG and what
the user listed as the reason for the shift. The date range on this report is the Query Create Date (The
date that the query was initially created and sent)
Queries with same DRG & No Shift Reasons Not Included
By design, the Query Impact Report only reports queries that had an impact by either having
different before-and-after DRGs or by having shift reasons. The queries not displayed in the Query
Impact Report had identical DRGs and no shift reasons, so they were excluded. Hence, the name of the
report – Query Impact Report.
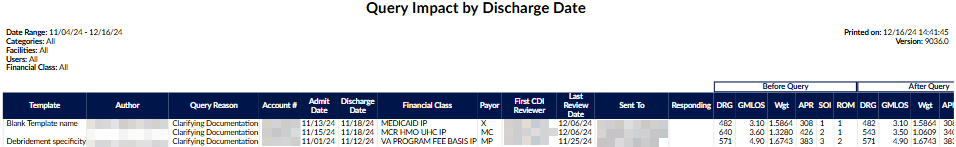
Query Impact by Discharge Date Report
This report includes all charts that received queries and resulted in at least one of the following:
- A change in DRG
- Change in CC/MCC/HAC Totals
- Other reasons your facility has defined as a query shift reason
This report will show you the impact that the query made. The report is based on the patient’s discharge
date and is grouped by query template name, then by Author, then by account #. The query will also
show if there was a shift in DRG and what the user listed as the reason for the shift. The date range on
this report is the Chart Discharged Date.
Queries With the Same DRG & No Shift Reasons Not Included
By design, the Query Impact Report only reports queries that had an impact by either having
different before-and-after DRGs or by having shift reasons. The queries not displayed in the Query
Impact Report had identical DRGs and no shift reasons, so they were excluded. Hence, the name of the
report – Query Impact Report.
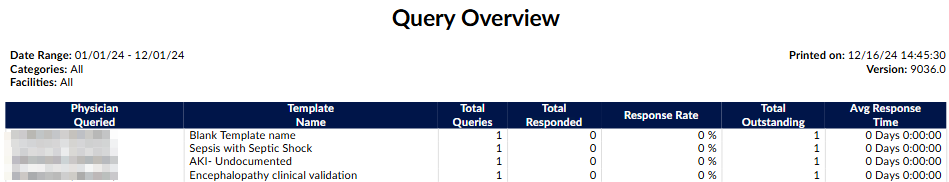
Query Overview Report
This report shows pre-discharge physicians query response or non-response and the template used. The
date range on this report is the Query Create Date (The date that the query was initially created and
sent).
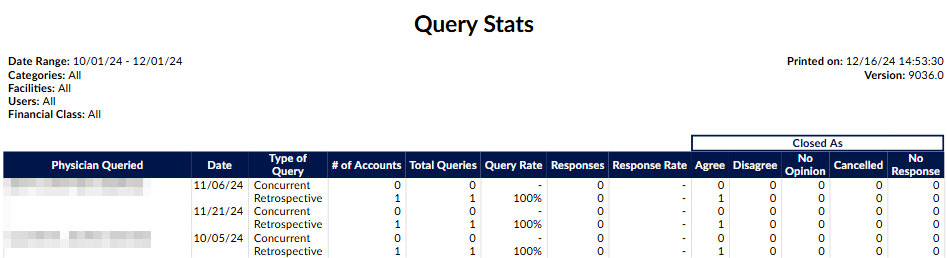
Query Stats Report
This report shows the physicians within the date range that were queried. The report will show how
many charts the physician was queried for and how many queries these charts resulted in. The date
range on this report is the Query Create Date (The date that the query was initially created and sent.)
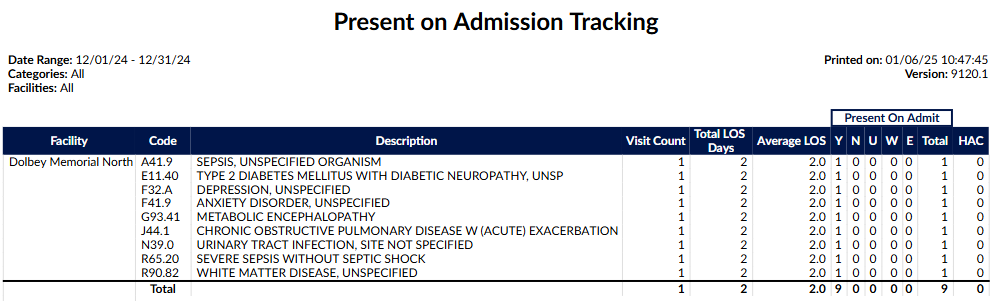
Present on Admission Tracking Report
This report is based on the date the patient chart was discharged and its final diagnosis codes. POA
Values will be listed, along with HAC determinations if they are present. The totals for the columns Visit
Count, Total LOS Days and Average LOS, (if available; Deaths, Autopsy Required) are figured per account,
the Totals for the Present on Admit and HAC columns are figured per code. The date range on this
report is the Chart Discharged Date.
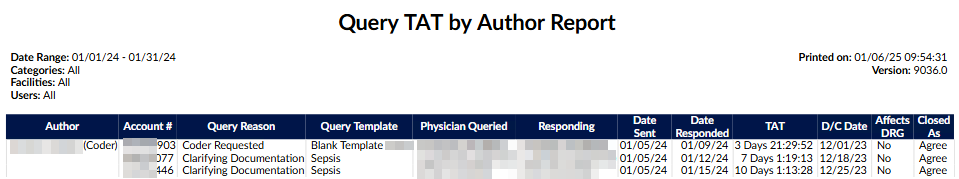
Query TAT by Author Report
This report shows all of the queries that have been responded, with who sent the queries and the turn
around time, which is based on the date/time it was sent to the physician until the date/time that the
query was responded. The date range on this report is the Query Create Date (The date that the query
was initially created and sent).
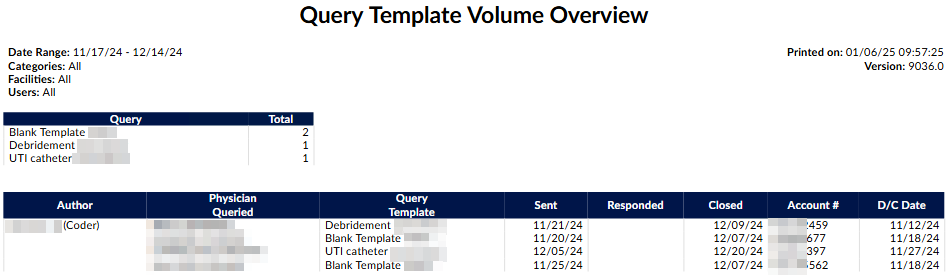
Query Template Volume Overview Report
This report shows the volume of queries per template sorted by whom the query was sent with the date
sent and then responded to then when it was closed as agreed, disagreed or no opinion per account
along with the discharge date. The date range on this report is the Query Create Date (The date that the
query was initially created and sent).
Query Template Volume by Discharge Date Report
This report shows the volume of queries per template for discharged accounts, sorted by whom the query was sent with the date sent and then responded to then when it was closed as agreed, disagreed or no opinion.
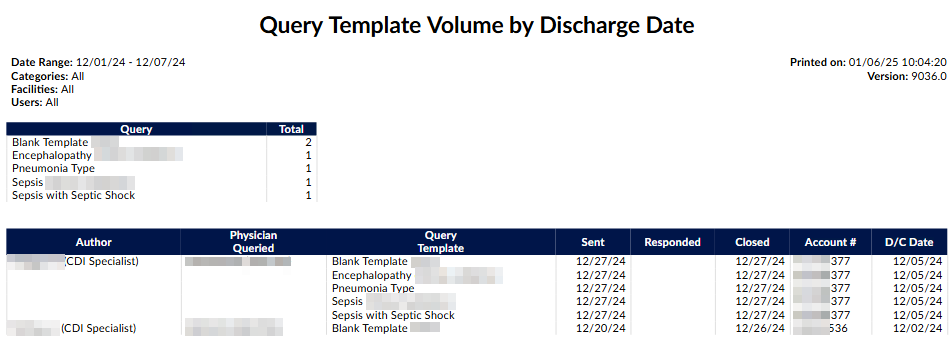
Info
This report is a clone of the “Query Template Volume Overview” report but the date range of the report is by Discharge Date instead of Query Creation Date. This means that only queries of discharged accounts will appear in this report.
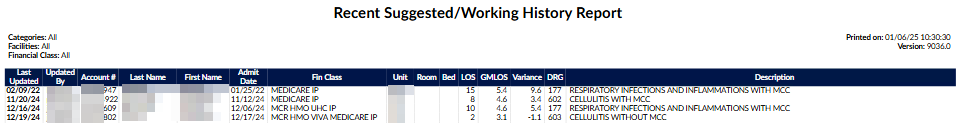
Recent Suggested/Working DRG Report
This report shows all unsubmitted inpatient accounts without a discharge date that have a calculated
Suggested or Working DRG, grouped by calculation date. Only the most recent Suggested or Working
DRG is displayed for each account. The ““Updated By”” column will say ““Suggested”” to indicate that
the DRG was calculated automatically from the Suggested DRG module. Sites that do not use the
Suggested DRG module can still use this report to get the most recent Working DRGs for all Inhouse
accounts. In addition to displaying the GMLOS, it also displays the LOS and Variance.
The date range is irrelevant and will report on all inpatient accounts with no discharge date that have either a suggested DRG (calculated by the Suggested DRG module) or a working DRG (calculated by a CDI Specialist).
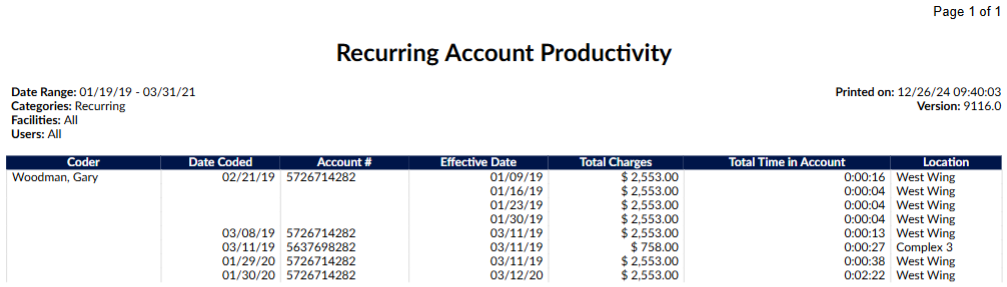
Recurring Account Productivity Report
This report tracks daily productivity for recurring accounts. It uses the effective date to track which
occurrence of the account was coded. An account can repeat on the report if the chart has been coded
multiple times on the same day with different effective dates. Total time in account is shown as
HH:MM:SS. The date range on this report is the Change History Audit Date (Submitted, Resubmitted,
Saved, Viewed actions
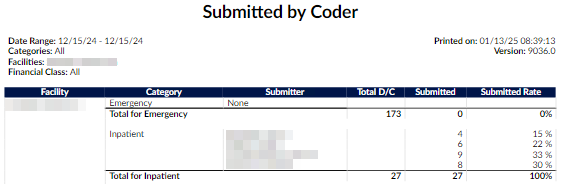
Submitted by Coder Report
This report shows the number of accounts submitted - grouped by facility, category, and submitter -
over the account discharged date range. The number of accounts submitted per coder is compared to
the total number of accounts per facility and category to calculate a submitted rate. Total discharges are
only displayed per facility and category. The date range on this report is the Chart Discharged Date
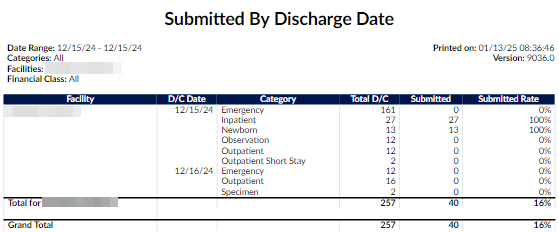
Submitted by Discharge Date Report
This report shows the number of accounts discharged, submitted, and percent of submitted - grouped
by facility, discharge date, and patient type over the date range. The date range on this report is the
Chart Discharged Date.
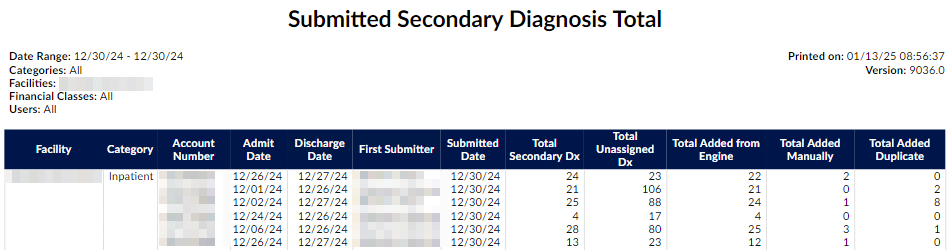
Submitted Secondary Diagnosis Total
This report is based on the first submit of an account. It shows the total number of secondary diagnoses
codes per account and whether the end user manually added the code(s), the system suggested them,
or the user added AND the engine suggested the code(s). In addition, the total codes still unassigned
upon submit will be shown.
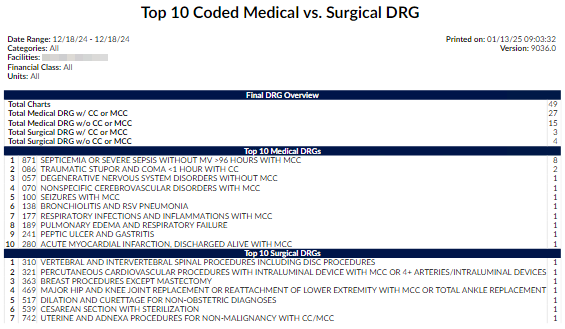
Top 10 Coded Medical vs. Surgical DRG Report
This report displays the Top 10 Medical vs. Surgical DRGs for submitted accounts within the defined
discharge date. Medical DRGs and Surgical DRGs are defined by the DRG type that is returned from the
TruCode or Solventum CRS encoder. The date range on this report is the Chart Discharged Date (Must be
Submitted and have a Final DRG).
User Audit Trail Report
This report shows user activities within the selected date range. Not selecting a User will result in only
system events being displayed. (Filtering: Max of 1 user selected; max of 1 day selected). The date range
on this report is the Date & Time of the action of the activity.
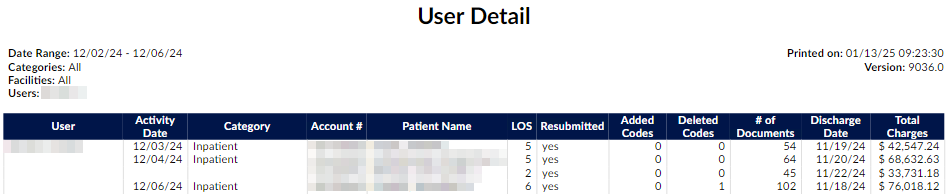
User Detail Report
This report shows the detail of the accounts that are coded including re-submits, the codes
Added/Deleted by the coder, number of documents, and Total Charges amounts — grouped by coder
over the date range. (distinct accounts) Date Range is the date the account was submitted, beginning of
start date to the ending of end date. (Filtering: Minimum of 1 user selected; max of 7 days selected). The
date range on this report is the ChangeHistory Audit Date (Submitted actions).
User Login Report
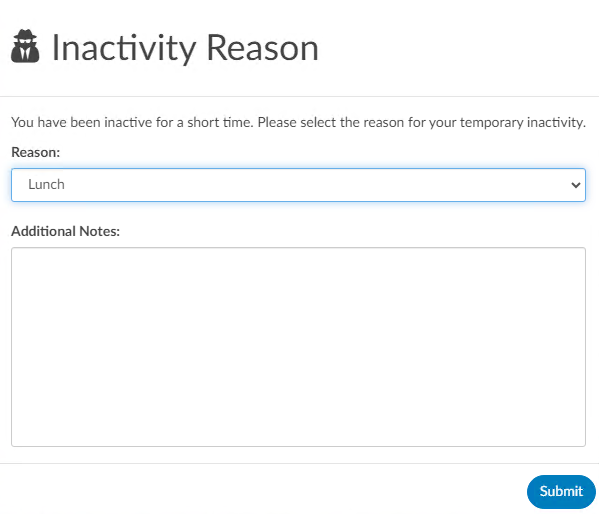
This report shows the login/logout activity of the user. If an inactivity reason was recorded by the user, then the prior logout will be listed as ‘inactivity’ instead of logout and the inactivity reason will be recorded in its own column. Date range available is 31 days, the report will never show the current day’s activity.
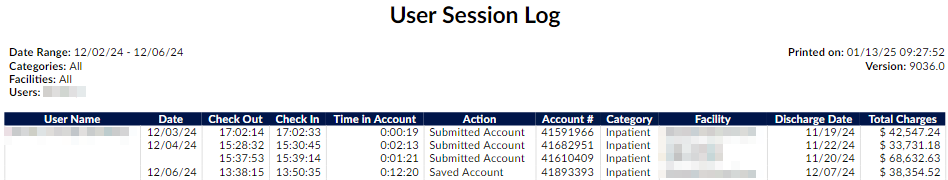
User Session Log Report
This report shows the users log showing the Checkout time (when user went into the account), Checkin
time (‘Saved’, ‘Submitted’, or canceled activity in the account), and total time in the account per each
account session. (Filtering: Minimum of 1 user selected; max of 7 days selected). The date range on this
report is the ChangeHistory Audit Date (Check Out & Check In of the Account Dates).
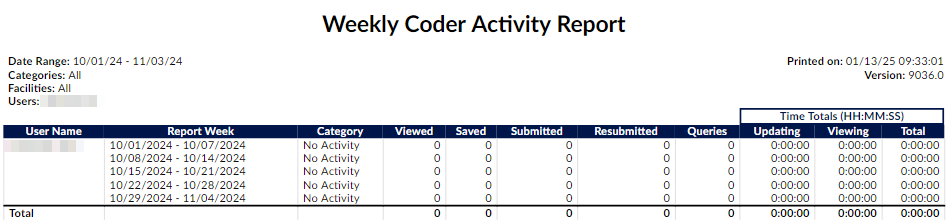
Weekly Coder Activity Report
This report shows the distinct number of accounts that were ‘Viewed’, ‘Saved’, ‘Submitted’, and
‘Resubmitted’, then the total number of Queries created, the total time updating, time viewing
accounts, and total time spent per week - grouped by coder then by category (patient type) over the
week range. The week range contains the date of the activity, beginning of start date to end date.
(Filtering: Minimum of 1 user selected). The date range on this report is the Change History Audit Date
(Viewed, Saved, Submitted, Resubmitted actions).
CDI Query Detail Report
This report provides details of physician queries created by CDI Specialists on accounts that have since
been discharged. This report details how the account evolved from a Baseline DRG to a Final DRG.
Any non-canceled physician query created by a CDI Specialist on an inpatient, now-discharged account
should appear as a line item on this report. The date range on this report is the Chart Discharged Date.
To qualify for this report the chart must be an inpatient patient type.
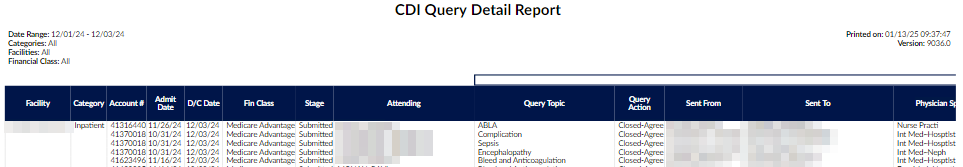
No PDF Support
Due to the number of columns, this report is not intended to be launched as a PDF.
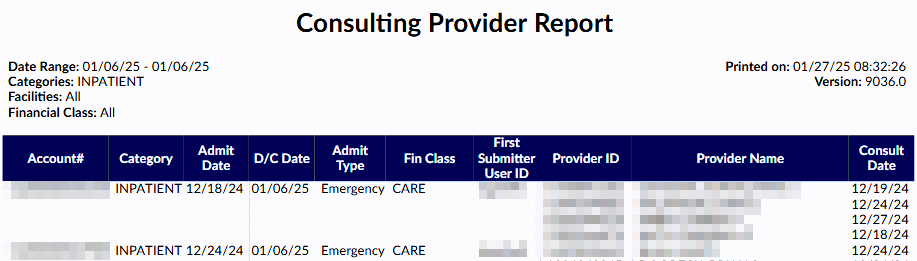
Consulting Provider Report
This report provides a list of all consulting provider(s) that were added to each account. The date range
on this report is the Chart Discharged Date. To qualify for this report the chart must be Submitted and
have at least one Consulting Provider.
Engine Outcome per Coder Report
This report should be used to show if the user is using code suggestions or manually adding codes. It will
show total assigned codes broken down by code set along with how many codes were suggested by the
engine versus added by text documents and non-text documents in addition to those that were added in
duplicate. Duplicate is defined by codes that both the engine and the end-user added the code. This
report card should be used as an educational opportunity to show possible improvements for the end-
user and/or code suggestions. This report is recommended to be used in conjunction with an audit.
The field Total Documents had to be constrained to count the total documents on the account with at
least one attached code to make the formulas correct. Documents with no codes suggested nor added
are not counted in this report and should not be since this report is about engine outcome. The date
range on this report is the Chart Submitted Date. To qualify for this, report the chart must be Submitted
with assigned codes.
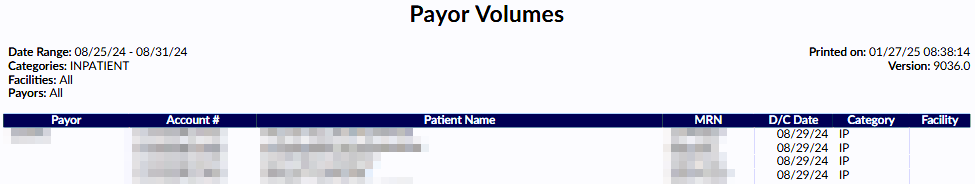
Payor Volumes Report
This report shows the submitted patient account number, full name, MRN#, discharge date, patient
type, and facility - grouped by payor with number of accounts submitted subtotals and grand total over
the date range. Date Range is the date the account was discharged, beginning of start date to the ending
of end date. The date range on this report is the Chart Discharged Date. To qualify for this report the
chart must be Submitted.
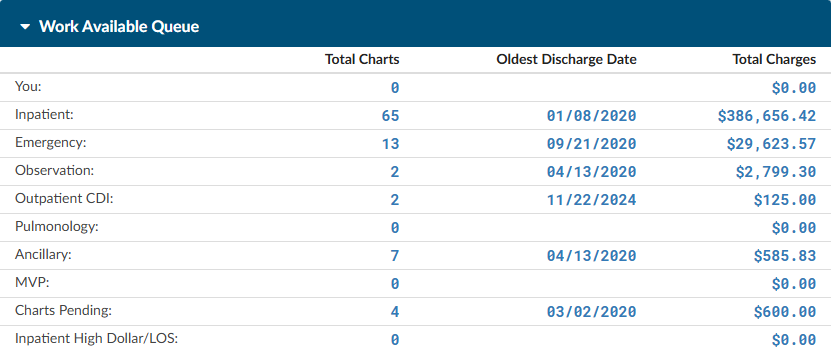
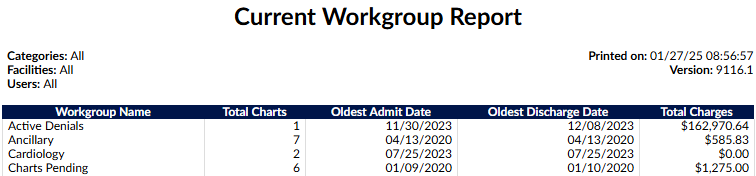
Current Workgroup Report
This report shows the list of all of the workgroups with the total charts, oldest admit and discharge date
along with total charges.
Date Range not Used
The date fields below are not used for this report. The current workgroup assignments are reported.
User Filter Behavior
- If no user is filtered on this report, this report will output the current workgroup statistics for all enabled workgroups that do not have a workgroup type of “Purge” (more info below)
- If one or more users are selected as a filter, this report will output the current workgroup statistics for the workgroups that are assigned to only those users (mimicking the workgroup list that appears in the user’s personal dashboard).
- CDI workgroups can have a blank “oldest discharge date” since no accounts in CDI workgroups typically have a discharge date.
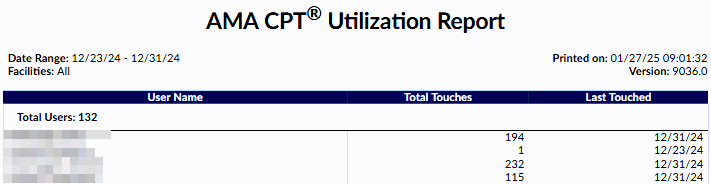
AMA CPT Utilization Report
This report lists all users who have added or edited CPT codes on accounts for a specified date range for
AMA license reporting. This is a report Dolbey uses to report CPT code usage to the AMA.
Topics
User reports can be categorized by topic, per organization.
For example, the following reports might be added to a topic of Impact Reports:
you are running reports.
- Physician Query Impact
- Physician Query Impact by Discharge Date
- CDI Financial Benefit
Reports can be filtered by topic to narrow down the list of available reports.
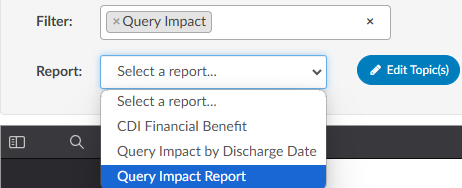
To assign a topic to report
- Select the report
- Click Edit Topic
- Edit the selected report
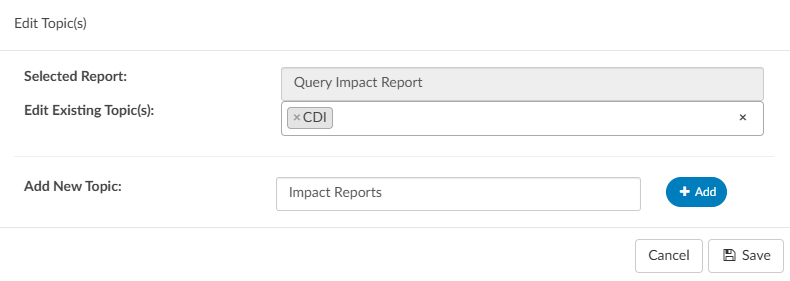
- Choose an exisiting topic from the dropdown menu
- Enter a name for a custom topic, and click +Add
- Click Save
Info
A report can have multiple topic tags.
Topics can be managed in the Topics Mapping Table.
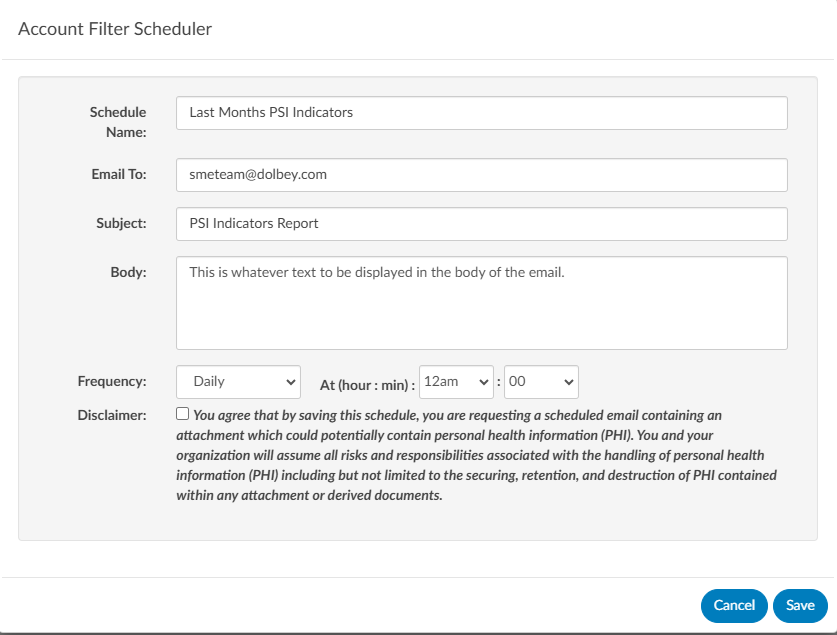
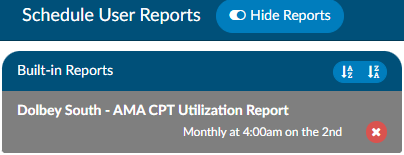
Scheduled Reports
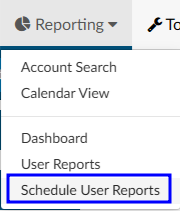
Reports in Fusion CAC can be scheduled to be delivered via email at specified times.
Clicking +Create New Schedule will open the scheduling options.
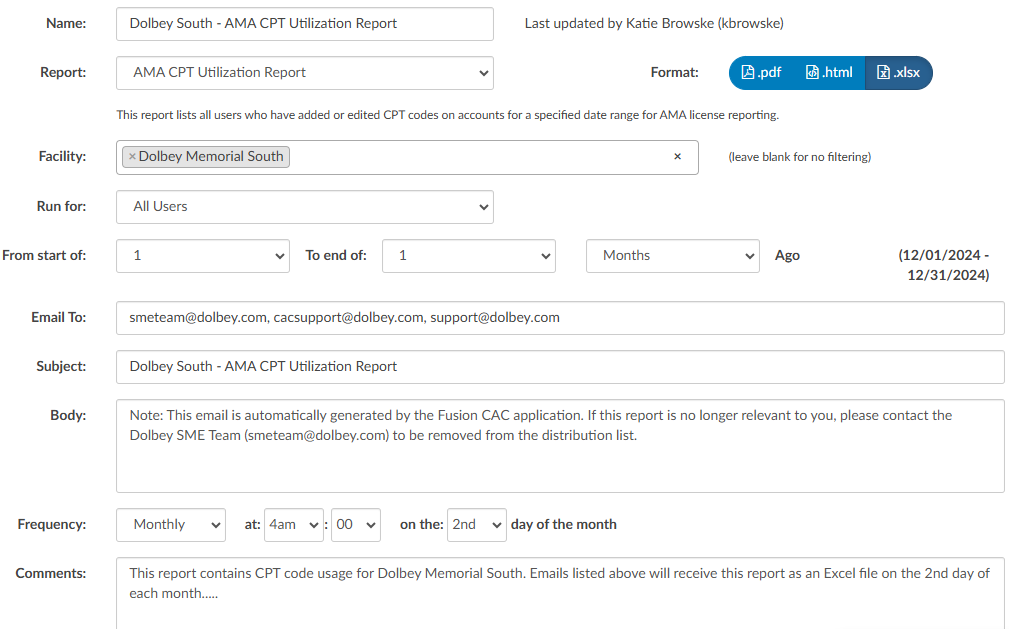
Click Save in the upper right hand corner to save the settings and start the schedule.
| Field | Purpose |
|---|
| Name | Name of the scheduled report that will display on the left hand side of the screen |
| Report | Dropdown list of User Reports available to be scheduled |
| Format | Format of the report when delivered to the recipient(s) |
| Disclaimer | Must be checked to acknowledge the report in question may contain PHI |
| Run For | Allows for filtering the report by role type (All Users, Auditors Only, CDI Only, Coders Only) |
| Date Range | Date range for the report. Can be set for X number of days or months in past |
| Email To | Email(s) for recipient(s). If sending to multiple people, email addresses should be comma separated. Receipients do not need to have an active Fusion CAC account to receive a scheduled report |
| Subject | Text to appear in the subject of the email |
| Body | Text to appear in the body of the email. It is recommended to include a note that the email is automatically generated and to include contact details for those who no longer want to recieve the report |
| Frequency | How often the report will be sent to the recipient(s). It is recommended to schedule reports outside of peak hours whenever possible for performance. |
| Comments | Note for management to keep track of report details. Text entered here will not be included in the email sent out |
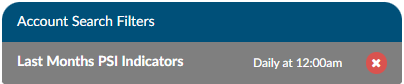
Saved reports will display on the left hand side of the screen.
Run History
Scheduled reports will have a run history.

A run history will display above the schedule data for the last three times the report ran, whether it was successful or errored. No text in the message column indicate the report ran and was delivered without error. A message of “No Message Returned” indicates nothing was sent as the report yeilded no results. The application will not send out a blank report.
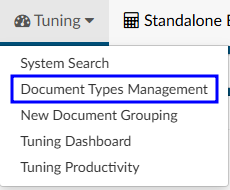
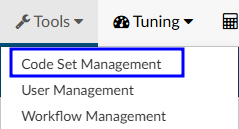
Subsections of Tools
Code Set Management
Code sets are commonly used groups of codes that can be saved for ease of use and productivity. Codes
sets can be saved by topic to provide a quick code assignment. Managers can create code sets to push out to coders and/or users can create their own.
Coding Standard Changes / Expirations
Code sets need to be regularly reviewed and updated by administrators to account for changes and expirations
in the ICD/CPT coding standards.
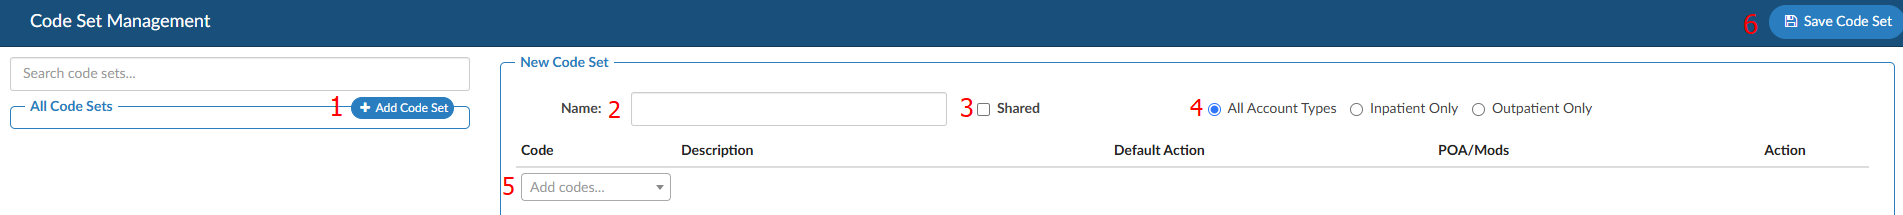
Create a Code Set
- Click on +Add in the Active Code Set navigation menu on the left hand side of the screen
- Name the code set so it is clear what codes it contains
- Select if code set should be shared. Check with management for the organization’s policy on code sets
- Choose what patient type this code set is relevant to
- Add codes into the “Add codes" box.
- Click “Save Code Sets” when completed
User Management
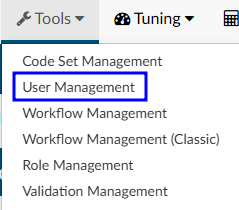
User Management allows management to add, delete, or change permissions and/or set work lists for other users. The grid view will display all users with a Fusion CAC User ID. The columns can be arranged in any order and saved per user.
| Column | Description |
|---|
| Action | Copy exisiting profile when creating new user: Edit existing profile:
 Remove unused profile:
|
| Locked | Indicates if the user is locked out of the application |
| Employee Number | Employee number from ogranization |
| User ID | Username used to log into the application |
| First Name | User’s first name |
| Last Name | User’s last name |
| Facilities | User’s assigned facilites |
| Roles | User’s assigned role(s) in the applicationied to their permissions |
| Workgroups | User’s assigned workgroups |
| Active User | Indicates if the user has active access to the application |
| Last Access Time | Date and time the user last logged into the application |
| Force Autoload | Status of Force Autoload for the user |
| Email | User’s email address |
Removing a Profile
A profile can only be removed if the user has not signed into the application. Once a user logs in, the delete icon will no longer show in their Actions column. This is to maintain accurate reporting. If a user should no longer have access to the Fusion CAC application, their profile should be locked.
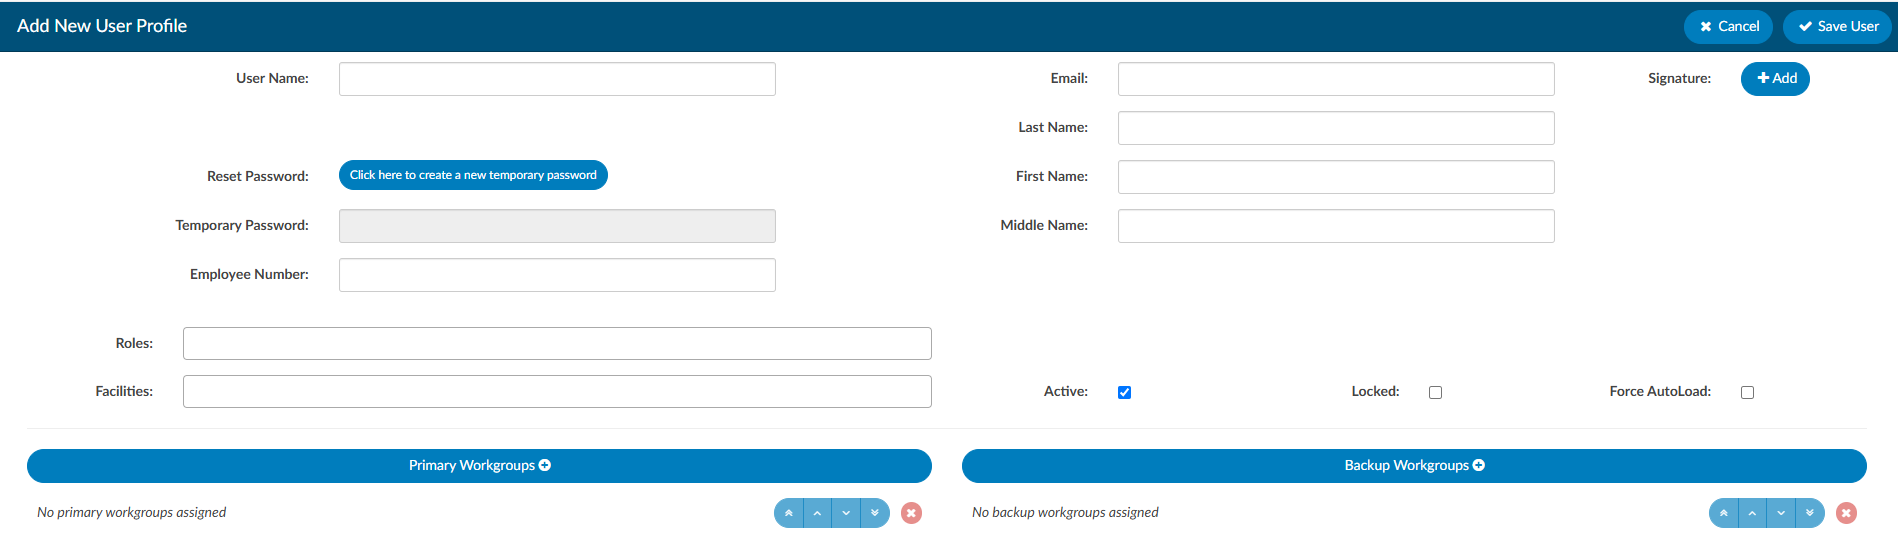
Edit User Profile
New User
+Add User allows management to create a brand new user profile from scratch
Copying a user profile will carry over some settings from an existing profile to a brand new profile
- Roles
- Facilites
- Chart Access
- Workgroups
User Name and Password (Required)
It is common practice for organizations to use LDAP to communicate with their Active Directory, which stores user information such as usernames and passwords. When a user logs into Fusion CAC, the application can use LDAP to check Active Directory for the user’s credentials. In short, LDAP allows the application to use existing usernames and passwords from Active Directory, so users do not need to remember separate login credentials specific to Fusion CAC.
For this process to work, the credentials entered into Fusion CAC must be identical to the Windows login provided by the organization. As long as the user name matches, there is no need to enter a password when creating a new profile in the application. Fusion CAC will be able to link to Active Directory and the end user can log into the application using the same information they use to log into their work computer.
User Name Cannot be Changed
Once a user name is entered it cannot be edited. If a profile is created with an invalid user name, a new profile with the correct user name must be created. This is to maintain consistency for reporting. If the incorrect profile is never used, it may be removed from the User Management page.
Employee Number
If applicable, the user’s employee number can be entered. Only administrators can see and edit user Employee Numbers.
Roles
In Fusion CAC, roles determine the permissions and privileges a user has while navigating the application. Users can have multiple roles. Roles can be configured by management in the Role Management tool.
Default roles include:
| Role | Description |
|---|
| Viewer | Can view the patient chart but cannot make changes. |
| Coder | Can view the patient chart, as well as add, delete, and change codes and DRGs on the coding abstract. Can add and remove items on coding forms, access editable fields in account information, and add notes and bookmarks. |
| Physician Coder | Can view the patient chart, add, delete, and change codes for physician-specific coding. Can add and remove items on physician coding forms, access editable fields in account information, and add notes and bookmarks. |
| Single Path Coder | Can view the patient chart and has permissions to add, delete, and modify final codes for both physician and hospital coding. |
| CDI Specialist | Can view the patient chart, add, delete, and change codes and DRGs on the CDI abstract. Can add and remove items on CDI forms, access editable fields in account information, and add notes and bookmarks. |
| Router | This role is an add-on for Coder, Physician Coder, or CDI Specialist roles. Enables users to manually route tasks to other users or workgroups, overriding the system’s automated workflow. |
| Auditor | Can view the patient chart and add, delete, and change codes and DRGs on the coding abstract. Can add and remove items on coding forms, access editable fields in account information, and add notes and bookmarks. Can also import previously submitted codes and initiate an audit worksheet. |
| CDI Auditor | Can view the patient chart, add, delete, and change codes and DRGs on the CDI abstract. Can add and remove items on CDI forms, access editable fields in account information, and add notes and bookmarks. Can also audit inpatient accounts on the CDI Audit Viewer. |
| Manager | Can do everything that Coders and Viewers can do. They can also add and delete users to the system from their own facility, change passwords, or change user roles. Managers can assign accounts to users and produce reports describing the state of the work queue and various coder statistics from their own facility. |
| Administrator | Can do everything that Coders and Viewers can do. They can also add and delete users to the system, change passwords, or change user roles throughout all facilities (if multi-site). Administrators can assign accounts to users and produce reports describing the state of the work queue and various coder statistics. |
Facilities
Multi-site organizations can assign specific facilities to users. Options in the dropdown menu can be customized using the Mapping Configuration tool. Once assigned, the user will only be able to acces charts from their assigned facilities.
Manager
The user can be assigned to an individual manager. Selecting a user from the Manager dropdown and saving the user will add/edit the manager assigned to the coder.

Managers only have accessibility to pull user reports and dashboard activities for the end users assigned to them. When the manager logs in and has at least one coder assigned to them, the coder and audit administrative dashboards will only show data relevant to the assigned coder(s). When the manager runs a User Report, the report will automatically be filtered to the users assigned to the manager. The manager is unable to gather any report information involving users not assigned to the manager.
For this feature, managers are defined as users with the role of “Manager” but not a role of “Administrator.” No users have managers by default, since the configuration of managers is entirely optional. Additionally, a user cannot be their own manager.
Email
The user’s email can be entered for documentation purposes, unless the organization is using the Enable Query functionality.
Name (Required)
Data entered in these fields are used to identify the user various areas of the application, including reporting.
Signature
Clicking +Add next to Signature in the top right corner allows each user to create a signature that will automatically be sent at the bottom of physician queries. This line
will appear at the bottom of Physician Queries to show who created the
query. A new button is located next to the user’s name in the user profile.
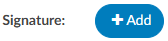
Clicking it will open a box allowing the user to create the signature.
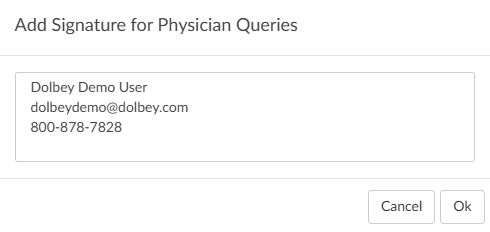
For formatting options, highlight the text in the signature box.
Enable Query
This setting is not commonly configured. Enable Query allows a user to send a Physician Query to a valid email, if the user receiving the query is added in User Management with a vaild email address.

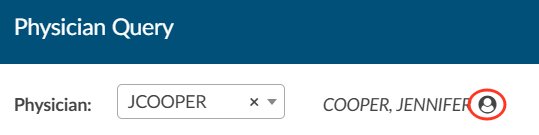
If that checkbox is checked, the user becomes searchable in the physician dropdown within a physician query.
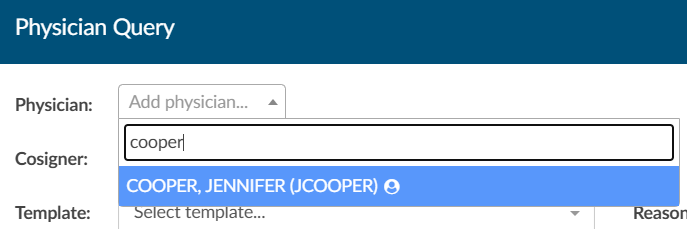
The user will only be visable upon typing in the User ID and will show a little person icon next to their name to indicate they are not a physician.
Email-based Physician Queries Only
Most sites sending physician queries choose to send to physicians in their MFN file rather than email. This feature was developed for a select few sites that do query through email.
This setting must be turned on by your Project Team or CAC Support. Enableing this functionality requires development work as an interface change is needed as to how and where queries are sent.
Active
This field allows management to revoke access to the system. If checked the user is active and can log into the application. If unchecked, the user is inactive and will not have access to the system.
Locked
The user will not be able to login until this box is unchecked. An account will automatically lock by incorrectly after three (3) incorrect sign in attempts. If a user’s profile is locked, they will not be able to log into the Fusion CAC application. Unchecking the box will allow the user to attempt to sign back in.
Active Directory Users - Reset Password
If a user forgets their password the system is configured to use Windows log-in (Active Directory), the password must be reset through the organization’s internal processes for resetting account information.
Workgroups
Workgroups selected from the dropdown are assigned to the user.
Assigned workgroups will display to the end user in the Assgned To: dropdown on the Accounts page.
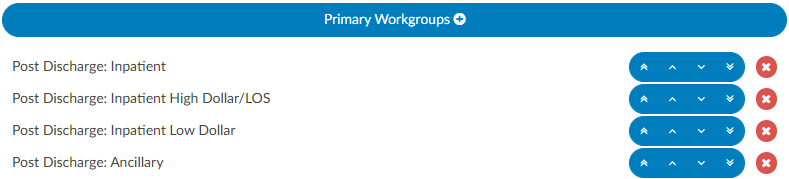
Primary workgroups will be presented to the end user first. Backup workgroups will be presented if there are no accounts availble in the user’s primary queues.
To select multiple workgroups at a time, hold the Ctrl key while clicking.
Force AutoLoad

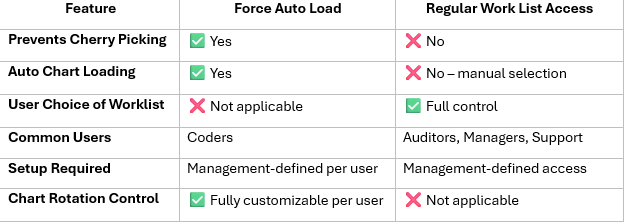
Force Autoload helps prevent cherry-picking by forcing the order in which patient charts are presented to end users. Dolbey recommends using Force Auto Load for high-volume coders where quality and productivity tracking is critical.
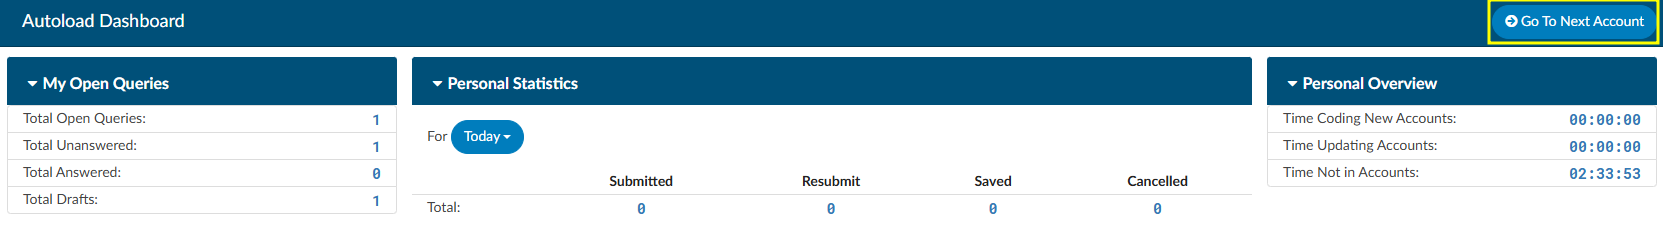
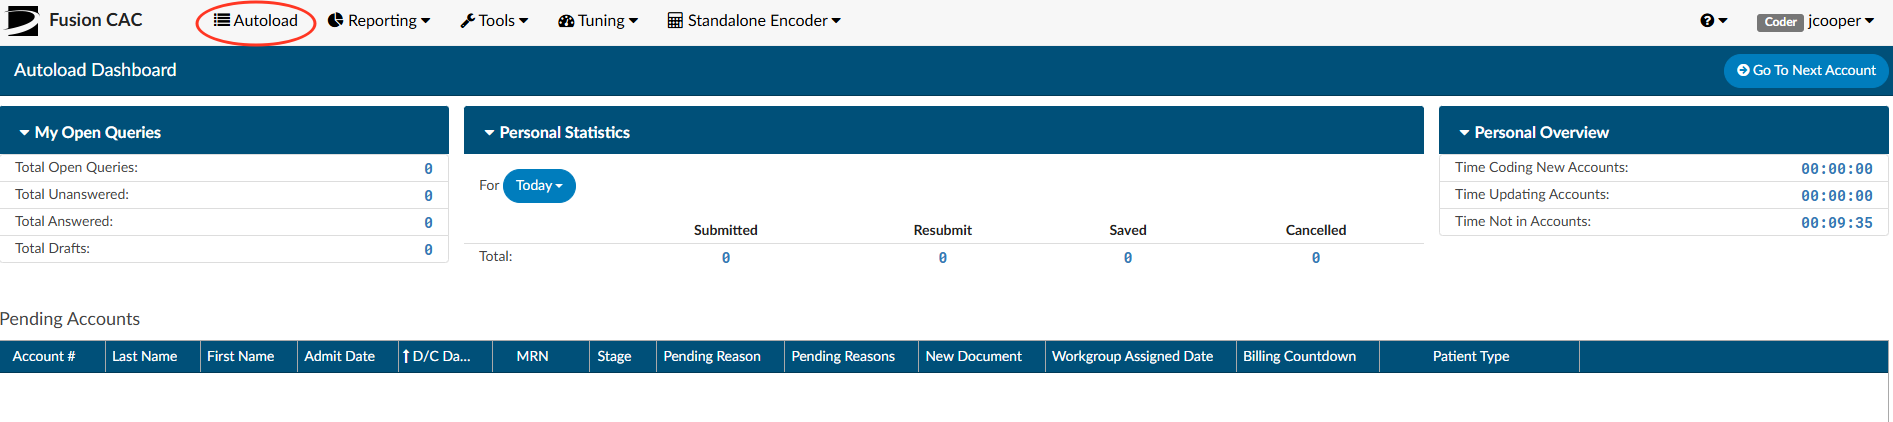
Users with ForceAutoload enabled will bypass the Account List page upon logging in and be directed to the AutoLoad page. To access their next account, they simply click Go To Next Account, which automatically loads the first available account from their assigned workgroups. The system follows the sort order set by the manager and skips any charts currently locked in use by another user.
One or multiple work lists can be assigned by management. Users will work the one assigned work list until complete or rotate through multiple based on the assigned workgroup limits. If there are no accounts left to work, the user will receive a message that there are no accounts in the queue.
Force Auto Load v. Regular Work List Access
Workgroup Limits
When Force Autoload is enabled, Limit: boxes will display next to each assigned workgroup.
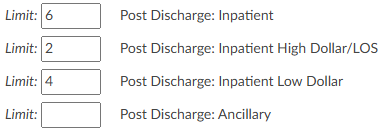
Managers can limit the number of accounts per workgroup the user will be assigned before they are presented with accounts from the next list. If no limit is set, the user will have access to however many accounts are currently in the workgroup. To transition to the next workgroup, the current workgroup must be fully completed.
Manual Routing Always Takes Priority
If an administrator routes a chart directly to the user’s “You” worklist, the chart will automatically be presetened before resuming normal workgroup priority order.
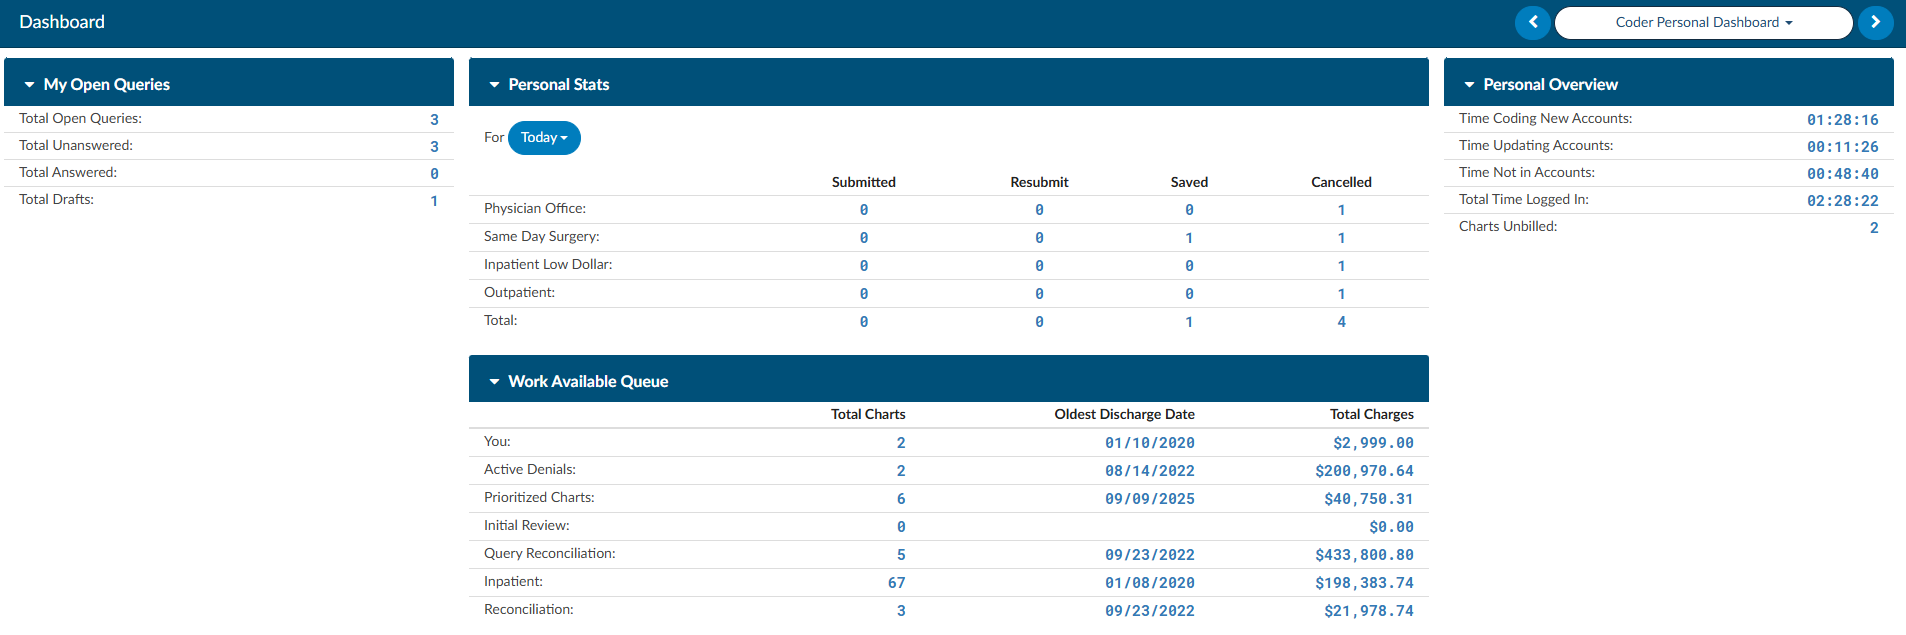
The Autoload page provides a copy of the Coder Personal Dashboard. The coder will also see a list of accounts they saved with a Pending Reason at the bottom of the autoload page.
Users can access their profile information by clicking on their name in the top right hand corner.
- Selecting “Profile” will open their profile. The user’s permissions will dictate which settings they are able to edit. Users with multiple roles will need to open their profile to switch roles.
- Log Out will log the user out of the application. It is recommened for users to log out when they are done working rather than just closing the browser window.
Today’s Productivity
Daily productivity stats are displayed when the user clicks on the bar graph icon to the left of the user’s ID. This is an alternative way for the user to quickly see their work if they are not looking at their Personal Dashboard.
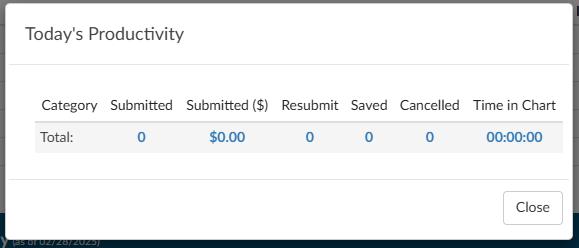
When the bar graph icon is clicked, the “Today’s Productivity” dialog box will open.
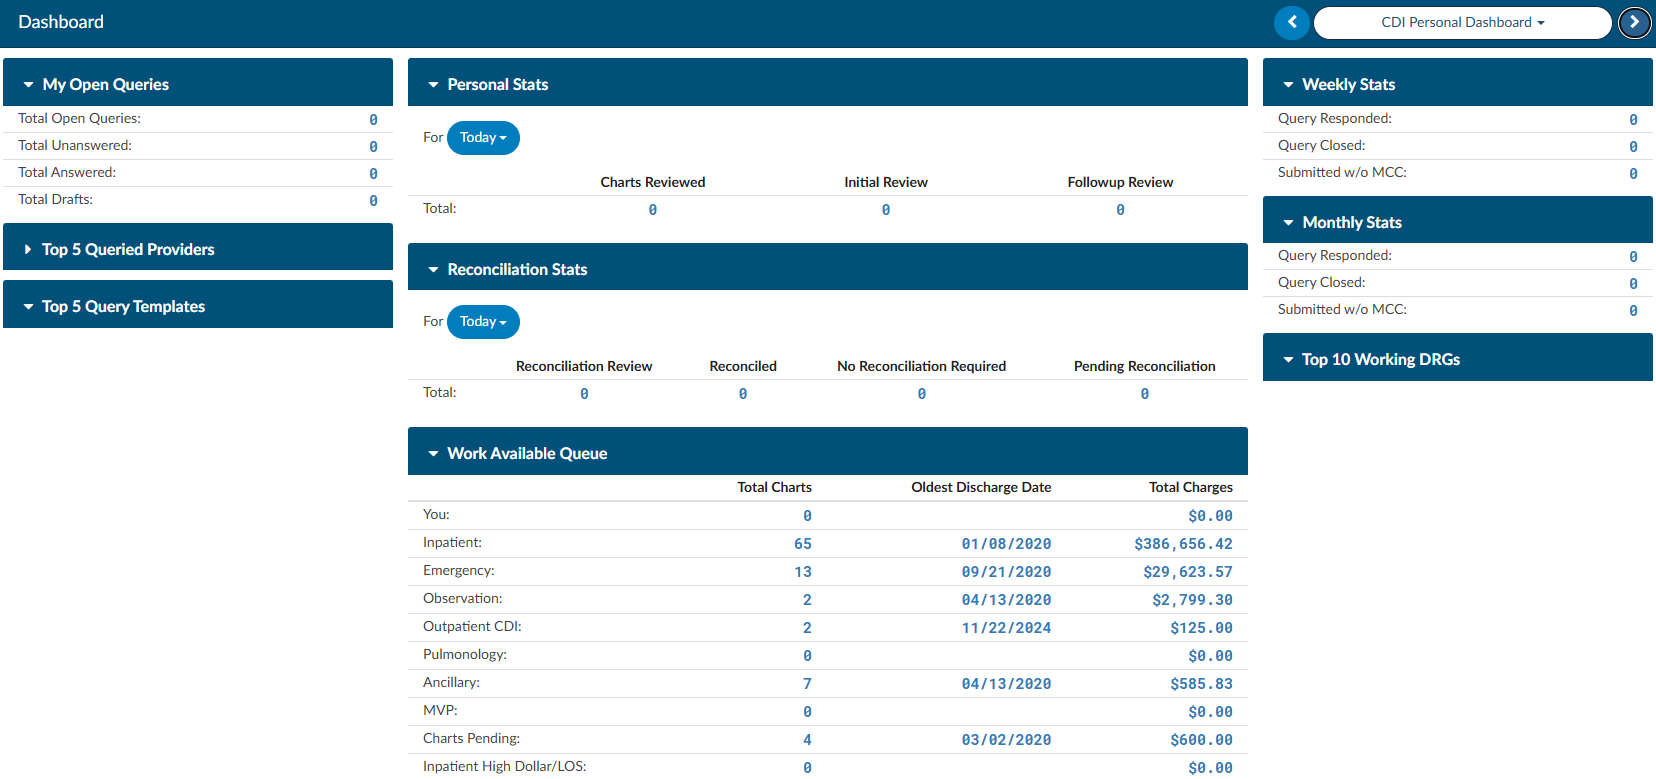
Coder/Auditor View:
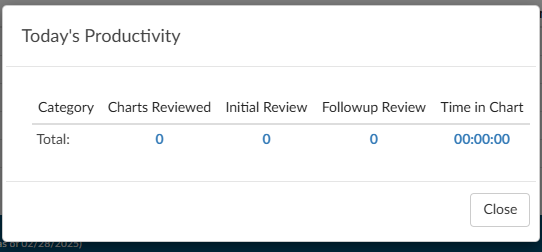
CDI View:
Workflow Management
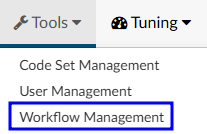
The Workflow Management tool allows Administrators to create, design, modify, and manage workflow(s) within Fusion CAC.
The purpose of a workflow is to systematically organize and streamline the patient chart activities for proper completion. Workflows are designed to improve efficiency, productivity, and collaboration between the various user roles by defining the sequence of steps, assigning responsibilities, and establishing the flow of information between different individuals or departments involved in the process. They ensure that tasks are completed in a structured and efficient manner, enabling organizations to achieve their goals more effectively.
Worklists
Worklists are organized into one of the following categories:
| Category | Description |
|---|
| Audit | Available for any charts needing an audit. This workflow can be used to define certain days for when charts are added to the Auditor worklist(s) |
| Autoclose | Process by which an ancillary patient chart can be autoclosed based upon a set of rules without coder intervention |
| CDI/Concurrent | ONLY valid if the patient chart does not have a discharge date and has a status of unbilled |
| Post Discharge | ONLY valid if patient chart has a discharge date and has a status of unbilled |
| QA Review | Available for any charts needing QA and/or for reconciliation workflow |
| Custom | Allows custom categories to meet unique client specification |
Categories are made up of one or more worklists. Each worklist is then made up of one or more criteria groups. For example:
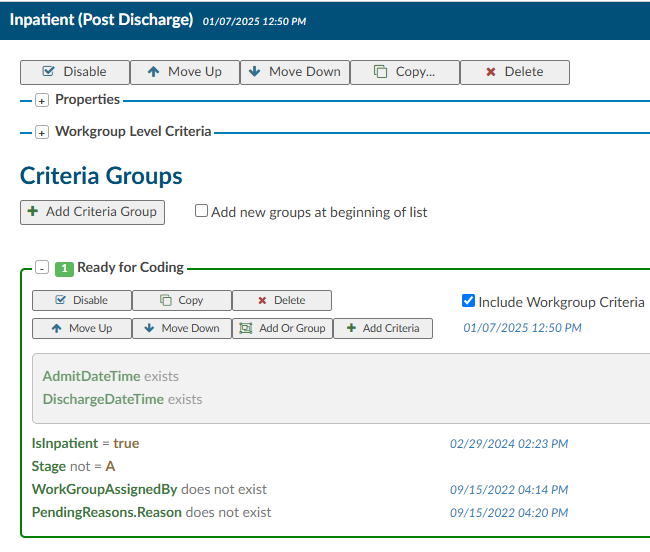
- The Post Discharge category
- contains the Inpatient worklist
- which has the Ready for Coding criteria group
- which is then made up of multiple pieces of criteria
It is possible for an account to be in more than one worklist at a time, depending on the category:
- An account may only be in one default category at a time.
- Custom categories allow an account to be in multiple custom categories at the same time.
- An account can also be in one default category and multiple custom categories at the same time.
- An account cannot be in more than one workgroup within the same category.
Often a worklist will contain multiple criteria groups. Each criteria group has many different filters to fully constrain the data. This ensures the appropriate number of charts are caught in each worklist.
Terminology
Worklist, Workgroup, and Queue are often used interchangeably when discussing sorting accounts into “buckets”.
Audit
Audit workflow collects charts meeting the specified criteria needed to be reviewed by an Auditor. The workflow can define certain days for when charts are added to the Auditor worklist(s).In Workflow Management the Audit default workgroup category is identical
to all other workgroup categories, but Audit workflow is triggered on a schedule instead of in real-time.
Example: Select that workflow automatically adds charts to the worklist on the first day of every month and last day of the month.
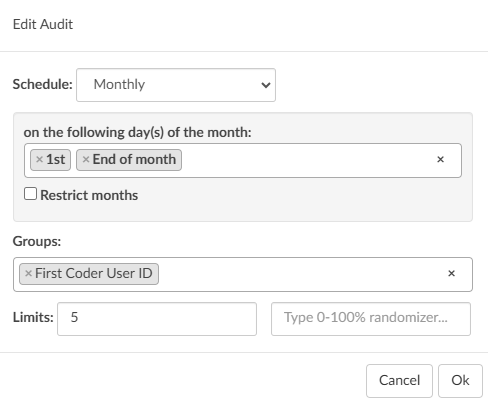
On the designated days every month, 5 charts (the limit can be changed) from every Coder (First Submitter) will be automatically routed to the Auditor’s worklist.
Note
If a month occurs that does NOT have the date set, (ex. the month of November does not have a 31st day) the month will not run an Audit worklow.
Schedule
The setting to determine when workflow will run for this Audit (Daily, Weekly, or Monthly).
Groups
One or more single fields to perform the grouping. For example, a grouping of “Last Submitter” and “Is Inpatient” would tell Audit workflow that after gathering the list of accounts, group them by unique Last Submitter and Is Inpatient.
Limits
The number of accounts to assign from each grouping. This value can be a maximum number, a
percentage, or both. Using the example above:
- Setting the selection to 5 maximum with no percentage means that for each unique group of “Last Submitter” and “Is Inpatient” accounts, randomly assign up to 5 accounts
- Setting the selection to 50 percent and 10 maximum means that for each unique group of “Last Submitter” and “Is Inpatient” accounts, randomly assign 50% of the accounts, up to 10 maximum
- Setting the selection to 50 percent with no maximum means that for each unique group of Last Submitter" and “Is Inpatient” accounts, randomly assign 50% of the accounts
Random Audit
The criteria filter, “Random Percentage” is included in the workflow criteria options. When set to a number
between 0 and 100 and detected in the workflow engine, a random number will be generated. If the
random number is less than or greater than the number in the filter criteria, the Criteria will match.
Random Inclusion Factor that is less than 20 will pass a theoretical 20% of accounts through the filter.
You don’t want to use this with equals (=) because it would always cause a ~1% result, and you don’t
want to use it with greater than (>) because it will pass an inverse percentage.
As noted, this is not going to be an exact percentage, only a theoretical one. In edge cases, you could
ask for “20% of accounts” and end up getting zero, or you could end up getting all of them, but most of
the time, you should get ~20%.
This field is intended to be used with QA Workflow, although the application will not prevent an
Administrator from using it in other types of workflow. Valid values for this field are from 1 to 99; any
other values in this field will not work.
Do not think of this field as a percentage, but rather as a 100-sided die. When workflow examines this
filter, it will “roll the die”. The common use case for this filter is “Random Inclusion Factor –> less than –>
10”.
AutoClose
This automation is the a process by which an ancillary patient chart can be closed by the application based upon a set of rules without Coder intervention. Autoclose is a process that takes routine outpatient visits and automates the coding process by submitting the chart directly to billing. This concept is known in the industry as autonomous coding.
Organizations often use AutoClose to ensure they can capitalize on the value of these ancillary charts while not sacrificing the staff they have.
Common outpatient service lines that make great candidates for AutoClose include:
- Screening Mammogram
- Sleep Lab
- Labs
- Chest X-rays
- ED Left Without Being Seen
- Canceled Accounts
- Cardiac rehab
- Dietary or nutritional counseling
- Esophageal motility studies
- Outpatient dialysis
- Pulmonary function tests
- Vaccine visits
The types of accounts eligible for AutoClose depend on the organization, the type of services offered, payor(s), and state requirements. The Dolbey SME Team is happy to answer any questions and will work with each organization to configure AutoClose.
With AutoClose, charts can be processed within seconds and the total turn-around time can be a little as a few minutes. Charts are processed 24 hours a day, 365 days a year with AutoClose. The impact AutoClose can have on revenue is one of the best benefits of this feature. Many
organizations AutoClose, on average, 10,000 or more charts per month. This equals out to about 120,000 outpatient visits AutoClosed per year without Coder intervention. That is an estimate of 2.5FTEs.
Completeing Charts
AutoClose can be set to complete charts on day one. Many organizations, however, choose to learn more about how the engine functions before AutoClose is enabled. Autoclose has a test mode which allows organizations to simulate what would have AutoClosed had it been enabled in production. This allows users to review and determine if AutoClose is ready for production at their facility.
Patient charts that pass AutoClose criteria are coded and submitted to billing. Those that fail AutoClose are rejected and routed to a worklist for Coder intervention. Rejected accounts are presented to the Coder with a failure reason.
As an organization expands their AutoClose capabilities, Dolbey recommends conducting regular audits to ensure the system captures and codes everything correctly.
Edit Workflow
Terminology
Worklist and Workgroup are often used interchangeably when discussing sorting accounts into “buckets”.
New Category
To add a new category in Workflow Management, click +Add New Category in the top right corner.
The dialog box has options to add a default/standard category or a new custom category.
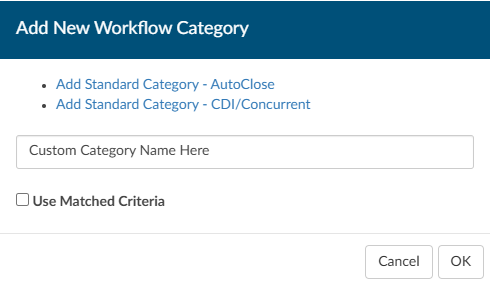
Add Worklist
To add a new worklist, click +Add under the appropriate category on the left hand side of the screen.
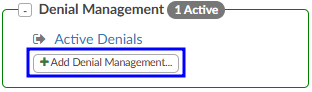
Name the new workgroup.
Add a Criteria Group
Name the Criteria Group something simple but meaningful to describe the reason accounts will move into the workgroup. This will help with
troubleshooting in the future.
Set Criteria
Workflow has two different criteria options to build workflow.
AND
All the criteria must be met for an account to “match” and be sorted into a workgroup.
For example, for an account to “match” with the Ready for Coding workgroup pictured below, the category must be inpatient and the admit date/time must exist and the discharge date/time must exist and the stage cannot equal A (submitted) and the workgroupassignedby cannot exist and it must not have a pending reason.
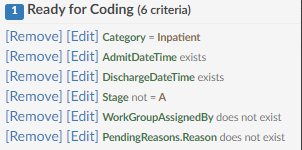
OR
At least one of the criteria must be met for an account to “match” and be sorted into a workgroup.
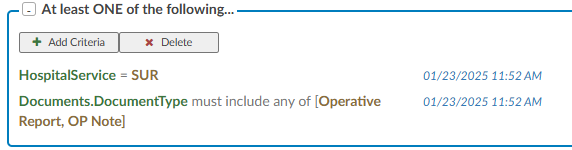
The OR criteria is listed in blue to call attention.
Workgroup Level Criteria
Workgroup level criteria works like all other criteria, but when enabled will apply to every group under that workflow. This alleviates the need for the same criteria to be added to all of the criteria groups.
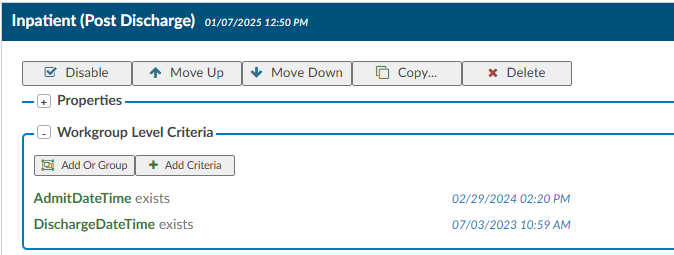
After setting the Workgroup Level criteria, check the box to include the criteria in the appropriate criteria groups.
This functionality helps to keep repetitive criteria creation to a minimum.
Add as many values as needed to ensure the data is sufficiently constrained so the appropriate charts make it into each queue.
Workflow Operators
Each criterion has a set of operators. Depending on the property slected, the operators may be different.
| Operator | Description |
|---|
| Equals | This is used if you have one value, and it must equal the value. This is case sensitive. |
| Not Equal | This is used if you have one value, and it must not equal the value. This is case sensitive. |
| > | This sign means that the value must be less than the value noted. |
| < | This sign means that the value must be greater than the value noted. |
| >= | This sign means that the value must be less or equal to than the value noted. |
| <= | This sign means that the value must be greater or equal to the value noted. |
| In List | If you have more than one value, it could be any of the following. |
| Not In List | If you have more than one value, you do not want it to equal. |
| Starts With | This operator is a search function that identifies resulsts where a string begins with a specific set of characters such as codes and document types. |
| Contains | If you have a word, phrase or value that can contain it must have what you added exactly. This is common when including payors. |
| Only Contains | Any one of the codes it is not needed to do all 3. |
| Exists | This will search to see if anything “exists” in this field, if it’s not blank it will match. No value is needed after the operator. |
| Does not Exist | This will search to see if anything “does exists” in this field if it’s blank it will match. No value is needed after the operator. |
| More Than | This operator is only used with date fields, you will need to define “more than” how many days ago. You cannot add a date into the field as this field will need to be dynamic therefore days ago is used. |
| Less Than | This operator is only used with date fields, you will need to define “less than” how many days ago. You cannot add in a date into the field as this field will need to be dynamic therefore days ago is used. |
| Later Than | This operator is only used with date fields, you will need to define the exact date you do not wish to exceed. |
| Is On | This is for an exact date, this is uncommon to use for workflow. |
| Weekday In | This operator allows the user to select the specific day of the week. |
| Hour In Range | This operator allows the user to select a range of hours for the admit/discharge date. |
| Hour In | This operator allows the user to select a specific hour of the day. |
| Last Month | This operator looks for specified criteria in the previous calendar month. Primarily used in Audit workflow. |
| This Month | This operator looks for specified criteria in the current calendar month. Primarily used in Audit workflow. |
| Includes Each Of | If you have more than one value, it must contain all of the following. However, note the chart must have each of the values but can also have other values. |
| Includes Any Of | If you have more than one value and it could be any of the following. |
| Does not Include | If you have more than one value, you do not want it to equal you must use “Not In List” |
Operator Values
Unless an operator does not require a value, the value field must be filled in to save the criteria.
Properties
Workgroup properties can be edited by clicking +Properties to expand the dialog.
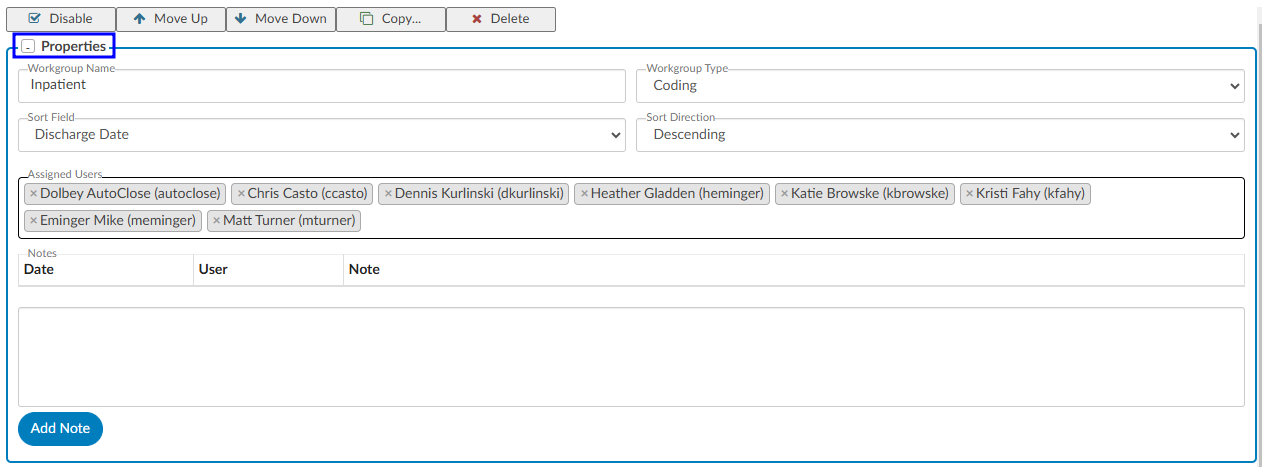
Workgroup Type
Workgroup Type is used to identify which team or department owns a specific workgroup. This classification is essential for determining ownership and accountability within the workflow. For example, to verify whether a particular chart is accessible or being held up, management can check which team owns that worklist. This property allows users to quickly identify the appropriate workgroup for reporting and ensure accurate tracking and visibility across departments.
Sort Field and Direction
Sort Field is used to define how patient charts are automatically organized when added to a worklist. This field determines the primary criterion for sorting, ensuring that charts are arranged in a consistent and logical order to streamline the workflow. For example, coding worklists are commonly sorted by Discharge Date to prioritize records based on when the patient was discharged.
After selecting the appropriate sort field, setting the Sort Direction allows management to specify the order in which the charts will appear:
- Ascending: Sorts the charts starting with the oldest date, ensuring that older records are addressed first.
- Descending: Sorts the charts starting with the most recent date, prioritizing the newest records.
This sorting mechanism helps users efficiently manage their workload by organizing patient charts in a way that aligns with their operational priorities, such as completing older cases first or focusing on more recent discharges.
Assigned Users
Users listed here are assigned to the worklist and will see it in the Assigned To: dropdown on the Accounts page.
Click in the assigned users box and select the desired user(s). Holding down Ctrl allows for selecting multiple users at once.
Click the X next to an assigned user to remove them from the worklist.
Notes
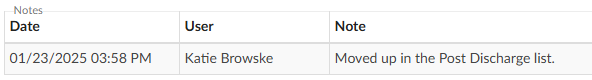
Notes can be added to indicate to anyone reviewing workflow management why changes were made to criteria or sequencing. As notes are added, they will be added to a table in the workgroup properties.
Reordering Worklists
When workflow is triggered, placement decisions are made top-down and inside-out
- Examine criteria in the first workgroup’s first criteria group
- Potentially assign the workgroup and criteria If the account meets all the criteria
- If no “match”, examine the next criteria group in the same workgroup (if applicable)
- If there are no more criteria groups, examine the next workgroup and repeat until a “match” is found
Worklist order matters because of how placement decisions are made.
Workgroups can be reordered using the buttons at the top of the worklist or by clicking and dragging the worklist name in the list on the left hand side of the screen.
Workflow History Edits
The Workflow Management page displays a running history of edits. A timestamp next to the worklist name will show the date and time of the last change made. Hovering over the date/time stamp will provide additional details. Clicking on that timestamp will open a log of changes made to the workgroup and criteria group(s).
Any change made to criteria will show as a timestamp to the right of the specific criteria that was changed. Hovering over the date/time stamp will provide additional details. Clicking on that timestamp will open a log of changes made to that criteria.
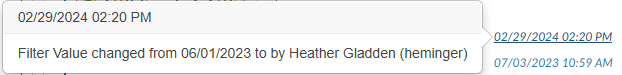
Users and Linked Users will now be seen under the name of the workgroup and will be defaulted
as collapsed. Clicking on the link will toggle the box open.
Manual Routing
Users with the ability to route charts, can right-click on an account and manually assign it to a user or workgroup.
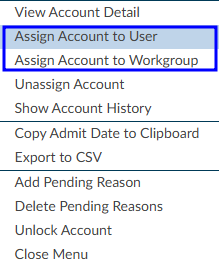
If an account is manually routed to a user it will populate their “You” queue.
Not Recommended
It is not recommended to manually route a chart unless absolutely necessary. Once a chart has been manually routed it will no longer move through workflow automatically.
A patient chart will only leave a “You” worklist when one of the following events occurs:
- The chart is submitted.
- Save and Route To is selected.
- The chart is reconciled or released from CDI.
- The chart is processed under Physician Coding workflow rules.
- The chart matches a Custom Workflow after a save.
- The chart contains a closed audit and is saved after review.
If a chart appears to leave the worklist unexpectedly, review the chart’s workflow history, routing
Understanding When a Patient Chart Leaves a “You” Worklist
The “You” queue is designed to display patient charts that currently require action from a specific user. In most cases, charts will remain on the worklist until the user completes an action that either routes the chart elsewhere or indicates that work on the chart is complete.
There are several system-defined events that will cause a patient chart to automatically leave a user’s “You” worklist. Understanding these events can help users determine why a chart is no longer visible in their queue.
Chart Submission
When a user submits a patient chart, the system considers the assigned work complete and removes the chart from the user’s “You” worklist. Submission is the most common method by which a chart exits the worklist and typically indicates that the chart is ready for the next step in the workflow.
Save and Route To
Users may choose to route a chart directly to another user, worklist, or workflow destination by selecting Save and Route To. When this action is performed, ownership of the chart is transferred according to the routing instructions, and the chart is removed from the current user’s worklist.
CDI Reconcile or Release Actions
When a patient chart is reconciled or released from CDI, the system treats these actions similarly to a chart submission. Because these actions indicate that CDI review activities have been completed, the chart is removed from the user’s “You” worklist.
Physician Coding Workflow
Charts assigned to users functioning as Physician Coders follow a specialized workflow. As part of this workflow, charts may automatically leave the “You” worklist based on physician coding rules and processing logic. This behavior is expected and differs from standard coding workflows.
Custom Workflow Processing
Whenever a user saves a patient chart, the system evaluates any configured Custom Workflow rules before applying default workflow behavior.
If the chart meets the criteria of a custom workflow, the chart is immediately routed according to the custom workflow configuration. Because the chart has been assigned to a new workflow destination, it is removed from the user’s current “You” worklist.
For this reason, if a chart appears to leave the worklist after a simple save action, users should verify whether the chart qualifies for a custom workflow rule. In most cases, the chart’s removal is the result of successful custom workflow processing rather than an issue with the default workflow configuration.
Closed Audit Processing
A chart may also be removed from a “You” worklist if it contains a closed audit. The system assumes that when a user opens a chart with a closed audit and subsequently saves the chart, the audit has been reviewed and no further action is required.
Because the audit-related work is considered complete, the chart is automatically removed from the user’s worklist following the save action.
Role Management
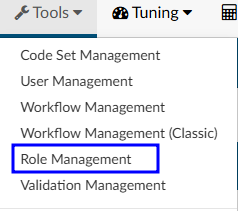
Under “Tools” in the application, is a tab for “Role Management”. Role Management allows administrators and managers to create custom user roles in the Fusion CAC application by checking or unchecking the box next to each of the privileges. By default, Role Management will already have privileges for each default role checked.
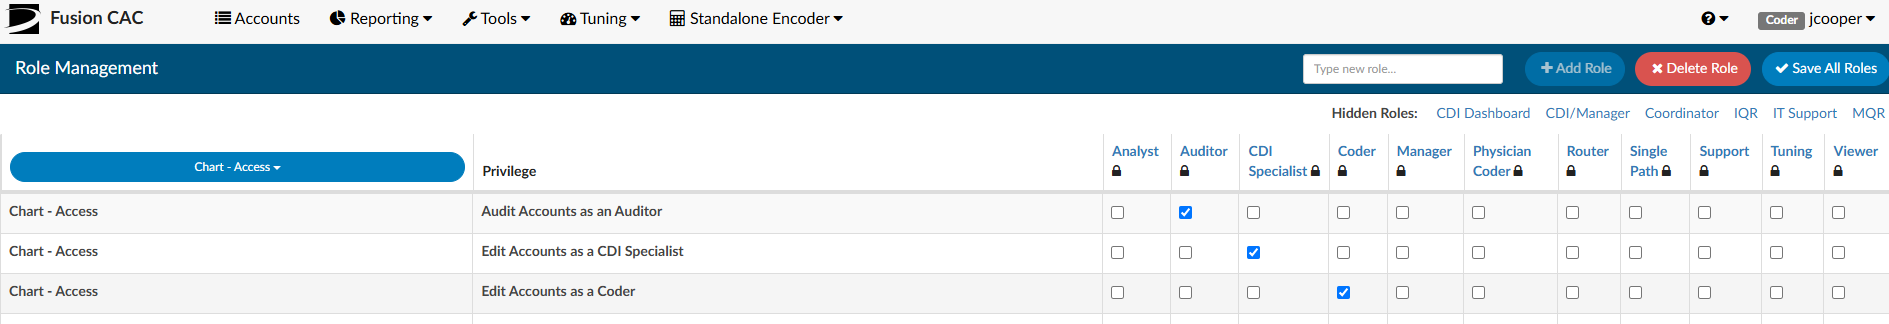
Note
Even though a role may have additional privileges, they will still maintain default chart access (Auditor, CDI Specialist, Coder, etc) to determine the assigned code tree and required fields within the software.
Create a New Role
Navigate to the Type new role… field in the top right corner of the screen. Enter the desired name for the new role (e.g., CDI Enhanced) and click the “+Add Role” button.

In the example of a “CDI Enhanced”, management may provide users with this role access to all previous CDI permissions while also enabling the ability to design queries. To start, replicate the settings from the CDI Specialist default role. Then, add privileges for the Query Designer to Create/Edit All Physician Query Templates.
Once all privileges for the custom role are selected, click Save All Roles in the top-right corner.
Features and Privileges
Privileges are assgined to roles for specific features within the application. To grant privileges, first identify the feature the role should have access to. Features can be viewed all at once or narrowd down using the blue dropdown list on the left side of the screen. Application features are sorted into the following:
- Chart - (Access, Editing, Physician Queries, Routing)
- Community
- Dashboard
- Document Types Management
- Grid Column Configuration
- Login
- Mapping Configuration
- Query Designer
- Reporting - (Account Search, Calendar, Scheduled Reports, User Reports)
- Role Management
- Shortcut Configuration
- System Search
- Tuning Dashboard
- Tuning Productivity
- User Management
- Workflow Management
- Worksheet Designer
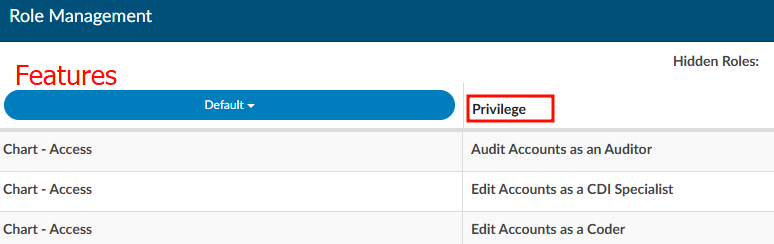
Hidden Roles
When editing custom roles, consider removing irrelevant roles to make the page easier to navigate. Columns can be hidden and unhidden by simply clickling on the role name. For instance, clicking on “CDI Specialist” will hide the corresponding column, moving it to the “Hidden Roles” section above the role columns. To unhide the role, click on “CDI Specialist” again and the column will reappear.
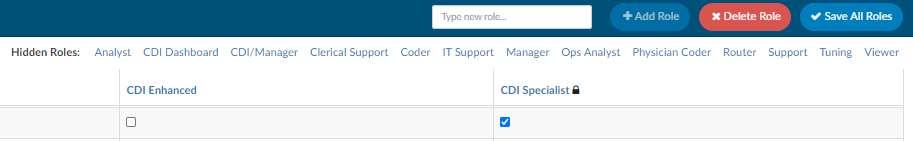
Deleting Roles
Click the “Delete Role” button in the top right corner to display a list of all custom user roles in the software.

The pop-up box for deleting custom roles provides a warning that any users assigned to the role will lose their privileges. As a best practice, reassign users to a different role before deleting the custom role to prevent them from being locked out of the software.
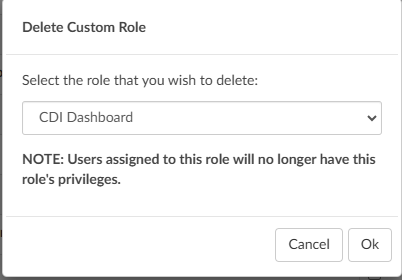
Locked Roles
A lock icon appears next to certain roles, indicating they are default roles within the application and cannot be deleted. In contrast, custom roles, which do not have a lock icon, are not tied to specific areas of the software and can be removed if needed.
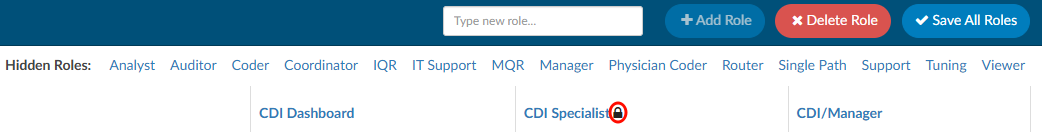
Validation Management
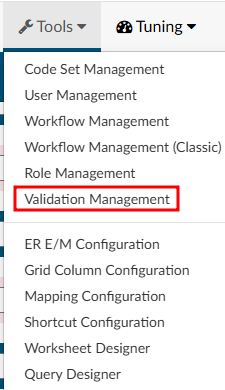
Validation Management allows user roles with the correct permission to create rules that show up on the code summary page prior to submitting an account. Rules can be made to prevent an account from being submitted until certain requirements are met, or issue a warning to alert users about potentially incomplete items while still allowing the user to submit an account.
Examples of rules that can be created include:
- An account must have a discharge date to submit an inpatient chart
- The newborn weight must exist on a newborn chart
- If a certain charge is on a chart and a diagnosis code is not present
Creating a Validation Rule
Begin by entering a rule name in the top right-hand corner of the page and then click on +Add Rule.
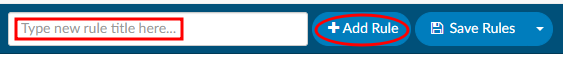
When the new rule is added, a number will be associated with the rule. The number will be used as reference when troubleshooting a rule that may not be working as intended.
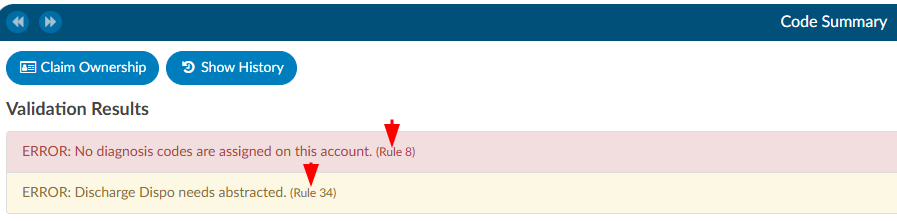
When a rule is triggered in Code Summary, the rule number will display on the right end of the rule.
Level Type
Once a validation rule has been added, the rule can be edited by clicking on the + to the left of the rule number.
Start by selecting the Level from the dropdown menu on the left-hand side of the screen.
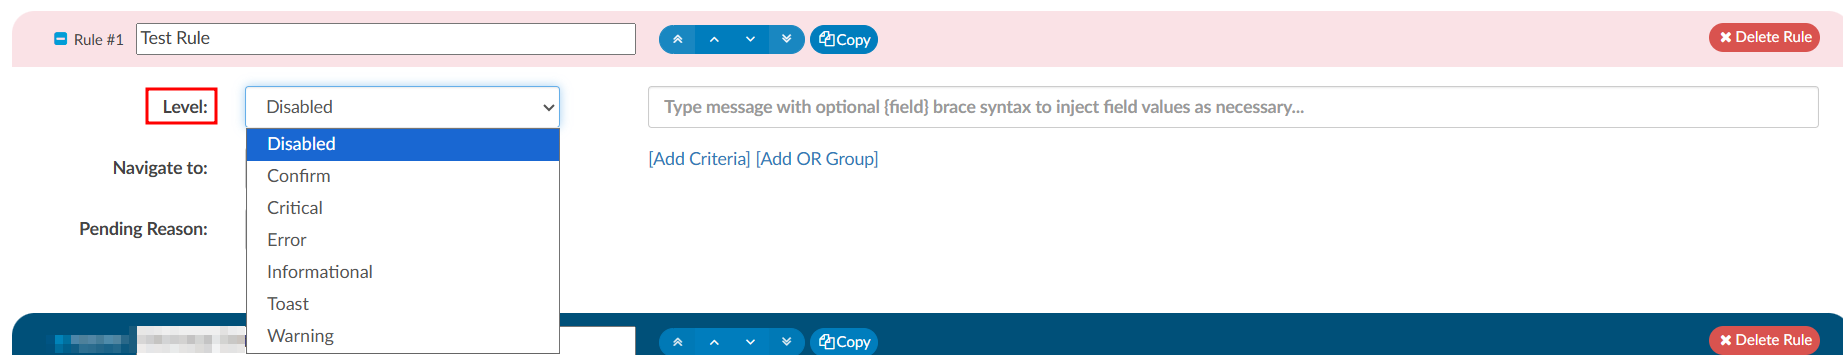
| Level | Description |
|---|
| Error | Must be resolved before the user can submit a chart. This validation rule typically only applies to Coders because CDI specialists do not generally submit charts. Errors have a red background, indicating there is a hard stop. |
| Critical | Same as an error, with an additional warning. If upon clicking save, the end-user still has a critical error, they will get a pop-up box that indicates they still have validation rules outstanding and will be asked if they wish to continue. This validation rule has a red background, indicating there is a hard stop. |
| Warning | A soft stop used to notify a user that there may be items to resolve. It does not prevent the user from submitting the chart. This validation rules has a yellow color background, indicating possible intervention is needed. |
| Toast Message | A notification that comes from the top right-hand corner of the browser as a red message presented for a few seconds. Toast messages do not stop the user from submitting or saving a chart. It is simply a notification message to alert the user. |
| Disabled | This level will disable the validation rule and prevent it from alerting the end user. The rule will turn red within validation management to show it is not active. |
| Informational | A notification will appear with a light blue background. These messages do not prevent the user from submitting the chart. |
Defining the Criteria
Once you have selected the level of the validation rule you want to create, you must define what the
criteria is starting with the verbiage you want to display to the end user. For example, you can display an
error if a chart does not have a discharge disposition so it does not get submitted to billing without one.
Since we would want to warn the Coder and not the CDI specialist, we would add another criterion input
so user role is not equal to CDI specialist. First, type in the display name; this will be what the user will see on the code summary.
Keep the information concise, but also provide how they can fix the error.
Example: Missing Discharge Disposition - The end user would know they have to add the disposition to continue.
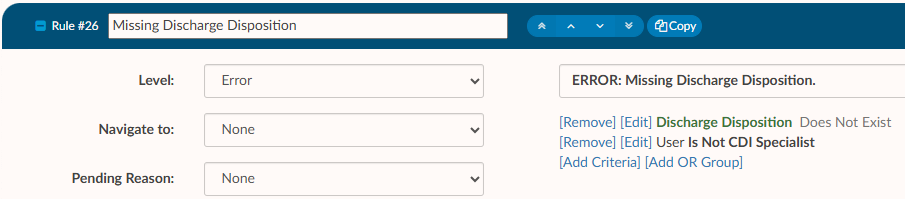
Type of Criteria
To add criteria to rule, as in the example above, click on Add Criteria to define how the system fires this rule.
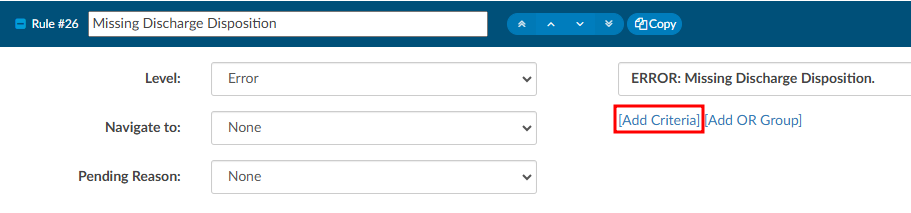
Upon clicking on Add Criteria, you will be presented with different types of criteria.
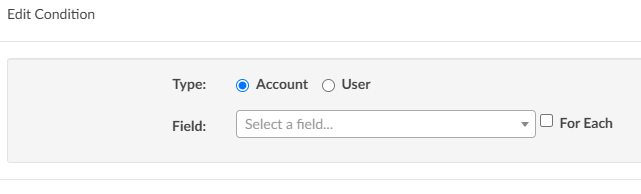
Account - Account type criteria allows you to select fields for a patient chart/account such as discharge
date, discharge disposition, admit date, procedure codes, diagnosis codes, and many others.
User - User type criteria allows you to restrict the rule to a certain user role(s), such as a Coder or a CDI
user role only. Typically, account-level criteria and user roles are used together, though account-level criteria can be used independently
of user roles. However, creating a rule based solely on a user role without specifying any additional account-level criteria is not
advisable.
Once you have defined the type of criteria, you can then add the details.
Example: Missing Discharge Disposition
Building criteria for a validation rule is much like workflow. For this example, select account, then in the
field name find Discharge Disposition. Once you drop in the field name, it will then give you other fields.
In this example it allows you to select an operator.
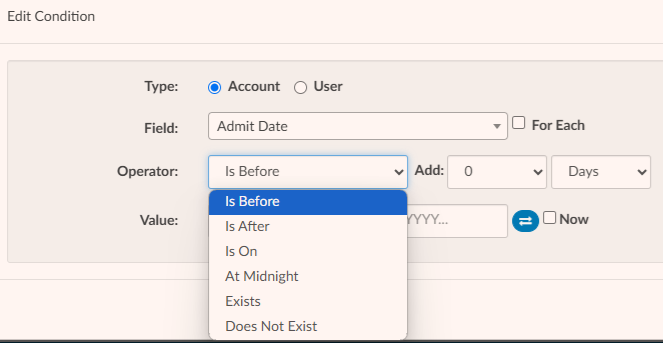
AND/OR Criteria
Validation Rules, much like workflow, has two different options to create a validation rule.
- AND criteria - think of adding the word “and” to the end of each criterion
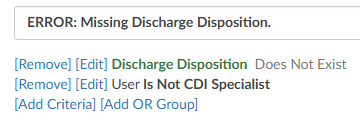 This rule will trigger if the user is a CDI Specialist and the discharge disposition does not exist
 - OR criteria - think of adding the word “or” to the end of each criterion in blue. OR criteria will turn blue
to differentiate between the conditions
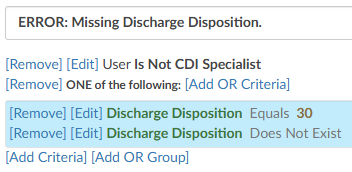 This rule will trigger if the user is a CDI Specialist and the discharge disposition equals 30 or does not exist
| Operator | Description |
|---|
| Equals | One value must be the same as another value. Case sensitive |
| > | The value on the left must be greater than the value on the right |
| < | The value on the left must be less than the value on the right |
| >= | The value on the left must be greater than or equal to the value on the right |
| <= | The value on the left must be less than or equal to the value on the right |
| In List | The value can be any of the following listed items |
| Not In List | The value can not be any of the listed items |
| Starts with | This operator is a search function that identifies resulsts where a string begins with a specific set of characters such as codes and document types. |
| Does not start with | This operator is a search function that identifies results when a string does not beging with a sppefici set of charatcters such as codes and document types. |
| Contains | The value can contains entered. This is common when including payors. |
| Only Contains | Any one of the codes it is not needed to do all 3. |
| Exists | This will search to see if anything “exists” in this field, if it’s not blank it will match. No value is needed after the operator. |
| Does not Exist | This will search to see if anything “does exists” in this field if it’s blank it will match. No value is needed after the operator. |
| More Than | This operator is only used with date fields, you will need to define “more than” how many days ago. You cannot add a date into the field as this field will need to be dynamic therefore days ago is used. |
| Less Than | This operator is only used with date fields, you will need to define “less than” how many days ago. You cannot add in a date into the field as this field will need to be dynamic therefore days ago is used. |
| Later Than | This operator is only used with date fields, you will need to define the exact date you do not wish to exceed. |
| Is On | This is for an exact date, this is uncommon to use for workflow. |
| Includes Each Of | If you have more than one value, it must contain all of the following. However, note the chart must have each of the values but can also have other values. |
| Includes Any Of | If you have more than one value and it could be any of the following. |
| Does not Include | If you have more than one value, you do not want it to equal you must use “Not In List” |
Once you have selected the field and your operator add a value.
Example: ERROR: D/C Disposition must be present We might select Does Not Exist as an operator. This would
mean if a discharge disposition does not exist, then this rule would display on the code summary and prevent
the user from submitting the chart.
Additionally, we may only want to display this rule if the user has a role of a coder. To constrain the rule further,
click on the Add Criteria again, select user, and then select “Is not CDI Specialist”. This will prevent the
rule from display to a user with a role of a CDI.
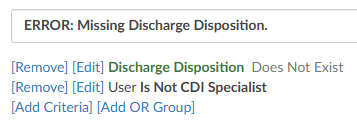
For Each Check Box
For each is used for fields that are repetitive. For example, a field like discharge disposition is a single
field (there are not multiple discharge dispositions on a patient chart) therefore, you do not need the
“for each” checkmark.
The For Each checkmark makes sense when you’re trying to create a rule that would have multiple
outcomes, such as checking if any diagnosis codes have a POA status of U. We don’t want to check only
the first diagnosis rather we want to check all diagnosis to see if it has a status of U. For Each can also be
used if you want to check if a procedure code has a date of service and/or provider attached. We don’t
want to just check the first procedure code for the date of service, we want to check each of them.
To use this field, first select For Each before defining a field. The system will open another drop-down
field to the right of For Each to indicate where you want to create the rule. There are only a handful of
fields the For Each field make sense for: charges, CPT codes, diagnosis codes, procedures, pending
reasons, and physicians.
Once you have selected a fields, you need to define the field you are looking for.
Example: Place an error reminding the Coder to add the POA status on any diagnosis code that has a U
Click on For Each, then select diagnosis codes. Select POA from the field drop-down menu which will
allow you to review operators. For this example, use the operator of Equals. Once you select the
operator of Equals, then you have a field to fill in the value, which would e be “U” in this example.
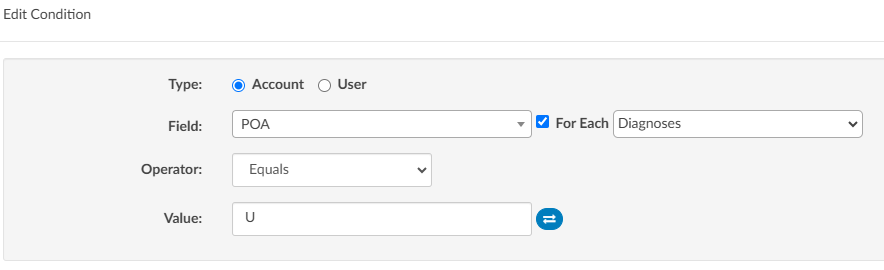
Adding Fields to a Rule
Fields can be added to the message displayed by rule to tell the user exactly what is triggering the rule when it is displayed in the Code Summary.
You can inject a field within the rule that will be displayed for the end-user. Do this by putting the field
name in braces exactly like this {Code}. When the rule fires for the end-user, it will display the code with
the issue. If there are multiple, use the For Each
field to see each of the codes that are the issue as
an individual rule.
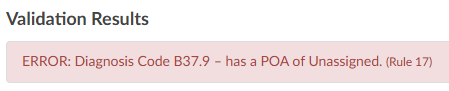
Navigate To
Once you have defined your rule, you will want to decide if it makes sense to take the end user
somewhere in the software to correct the issue based on the rule created. In the example of a discharge
disposition, it does make sense to direct the user to go to the account information
page as that is where they would likely change the disposition. Under where you
selected the level, there is a field for
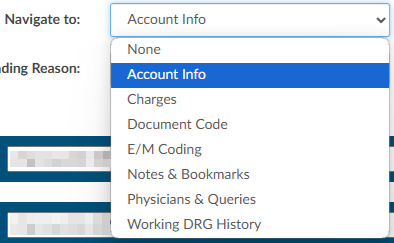
Navigate to (these are placed within the patient chart, under the Navigation tree).
- None – Will not take the user anywhere if they click on the error/warning.
- Account Info – Will take the user to the account information viewer.
- Charges – Will take the user to the charges viewer.
- Document Code – Will take the user to where the code was validated/added within the documentation.
- E/M Level - Will take the user to the E/M Level viewer.
- Notes & Bookmarks - Will take the user to the Notes & Bookmarks viewer.
- Physicians & Queries – Will take the user to the Physicians & Queries viewer.
- Web Page - Will take the user to the URL specified. Note that URLs must start with http:// or https:// and cannot be left blank if “Web Page” navigation is selected. From the Code Summary viewer, clicking on the validation rule will open the web page.
- Working DRG History - Will take the user to the Working DRG History viewer.
Pending Reason
This field will have a dropdown with all available pending reasons.
If a rule is triggered on an account and it has a pending reason
attached, then the pending reason will be added and the user will
be able to see the number of the rule. Pending reasons that have a
physician or date requirement will NOT be available in this list. The
only way to remove a pending reason that was added by a rule is
to have that rule cleared
Saving Rules
Once you’ve completed adding criteria for your validation rule
remember to click on Save Rules in the top right-hand corner. It is
recommended that you test your validation rule by opening a chart that
fits the criteria of your validation rule
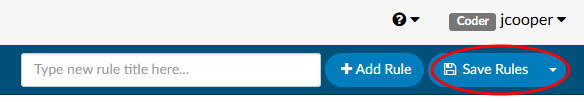
Validation FAQs
What is the difference in validation rules between Not In List and Does Not Include?
The difference applies to properties that contains lists. Here is an example:
Say you have an account with three assigned diagnosis codes: I10, R12, and Z36.
In Validation Editor, I’m building validation rules with the “Diagnosis Codes” property. In memory, the “Diagnosis Codes” property equates to a list of three codes – I10, R12, and Z36.
The validation criterion Diagnosis Codes -> Not In List -> Z36 is TRUE because there are codes in the list on the left – the three assigned diagnosis codes – that are not in the list of the codes on the right, which just has “Z36”. Those codes are I10 and R12.
The validation criterion Diagnosis Codes -> Does Not Include -> Z36 is FALSE because the list of codes on the left – the three assigned diagnosis codes – does indeed include the codes that are listed on the right, which is “Z36”.
ER E/M Configuration Page
Note
The organization must have ER E/M Module enabled to use this feature. If this is not currently enabled, please contact your account representative for more information.
Once the E/M Configuration has been enabled, the initial setup must be completed by the Dolbey Team. After this setup is finalized, your organization can make any desired changes directly or contact the SME Team (smeteam@dolbey.com) for additional support.
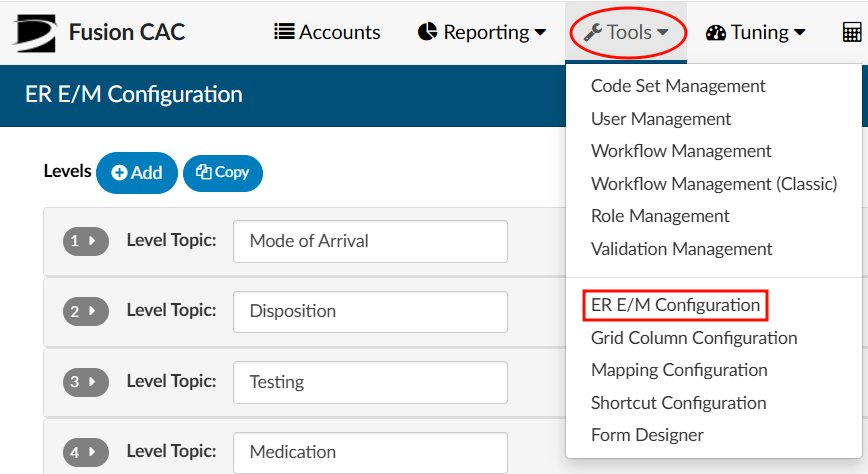
The configuration page allows for customization of the E/M Level Matrix and other related components. If the organization has Facility Mapping, the E/M Configuration can be copied across different facilities.
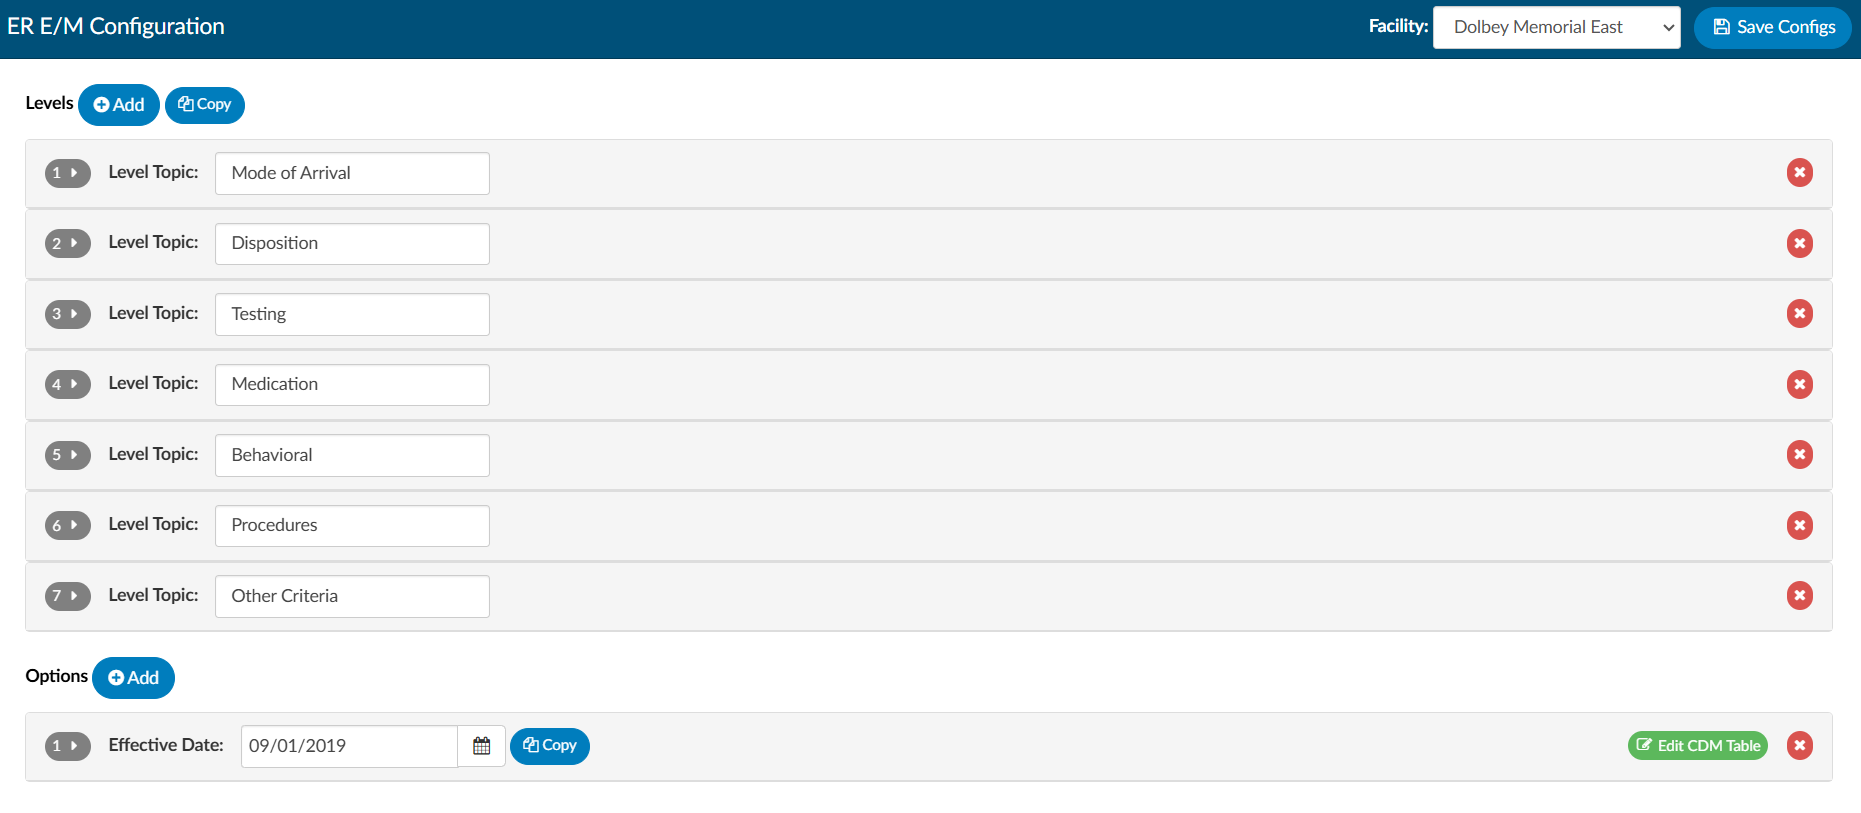
When Facility Mapping is available, the facility can be selected in the top right corner. Once a facility is selected, the levels associated with that facility will be displayed. Copy will also appear at the top of the Levels section to easily duplicate settings accross facilites.

Clicking Copy opens a dialog box to choose a destination facility to copy the current levels to. Facilities available for copying will be listed in a dropdown menu.
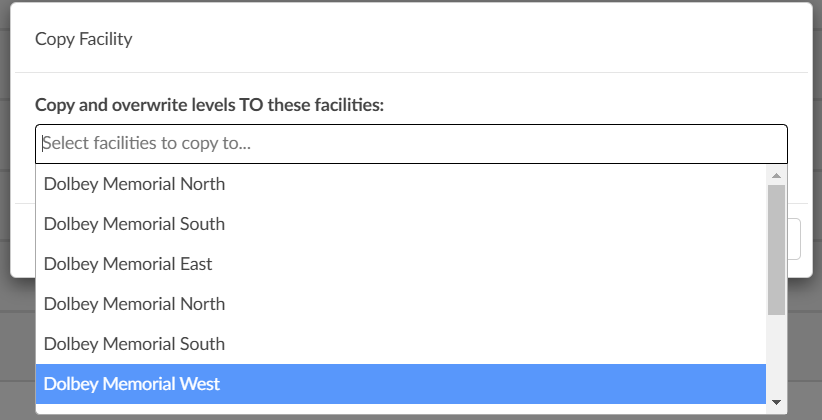
This option will overwrite and copy the current levels that are onscreen to the facility that is selected.
Note
If an organization has only one facility, the copy options will be hidden.
E/M Matrix
The table below illustrates how the E/M Matrix will appear to end users.
Text displayed in this table can be customized to tailor the information shown to end users.
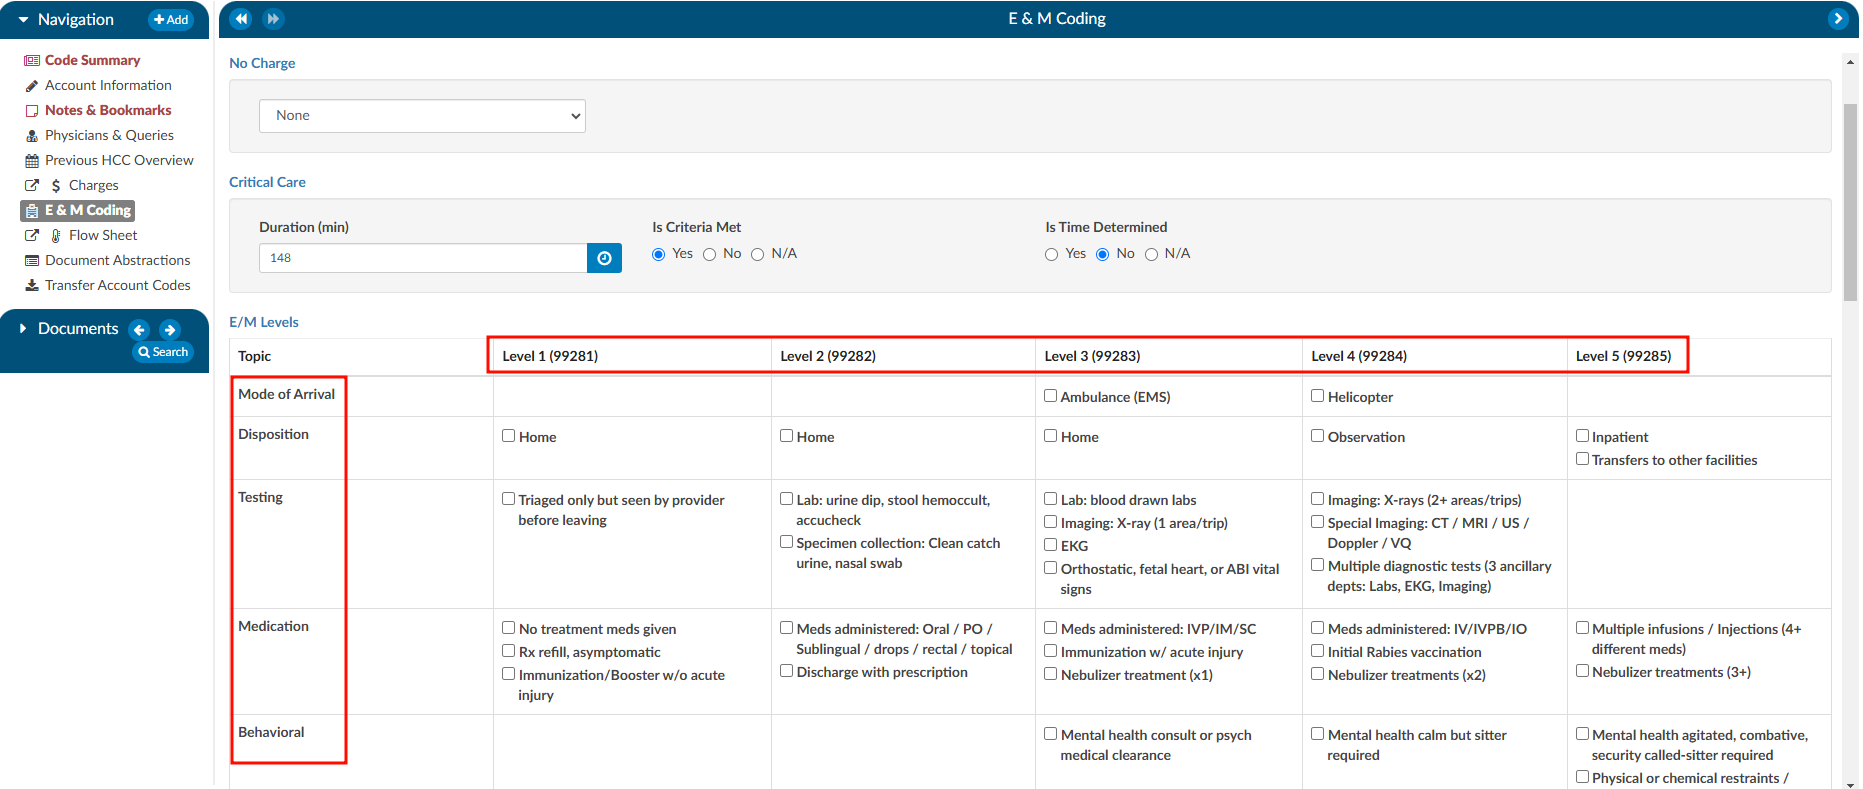
The E/M Level matrix features horizontal columns that display the levels across the top.
Below each level are the defining criteria organized into several topics, each with a list of relevant items. By default, these categories include:
- Mode of Arrival
- Disposition
- Testing
- Medication
- Behavioral
- Procedures
- Other Criteria
Topics are fully configurable based on the specific needs of each facility.
The E/M Matrix configuration allows organizations to customize the content within each field under the respective E/M Level,
enabling facilites to tailor the listed items for each code to meet specific requirements.
To make changes to the default options, click the grey numbers to open the matrix configuration.
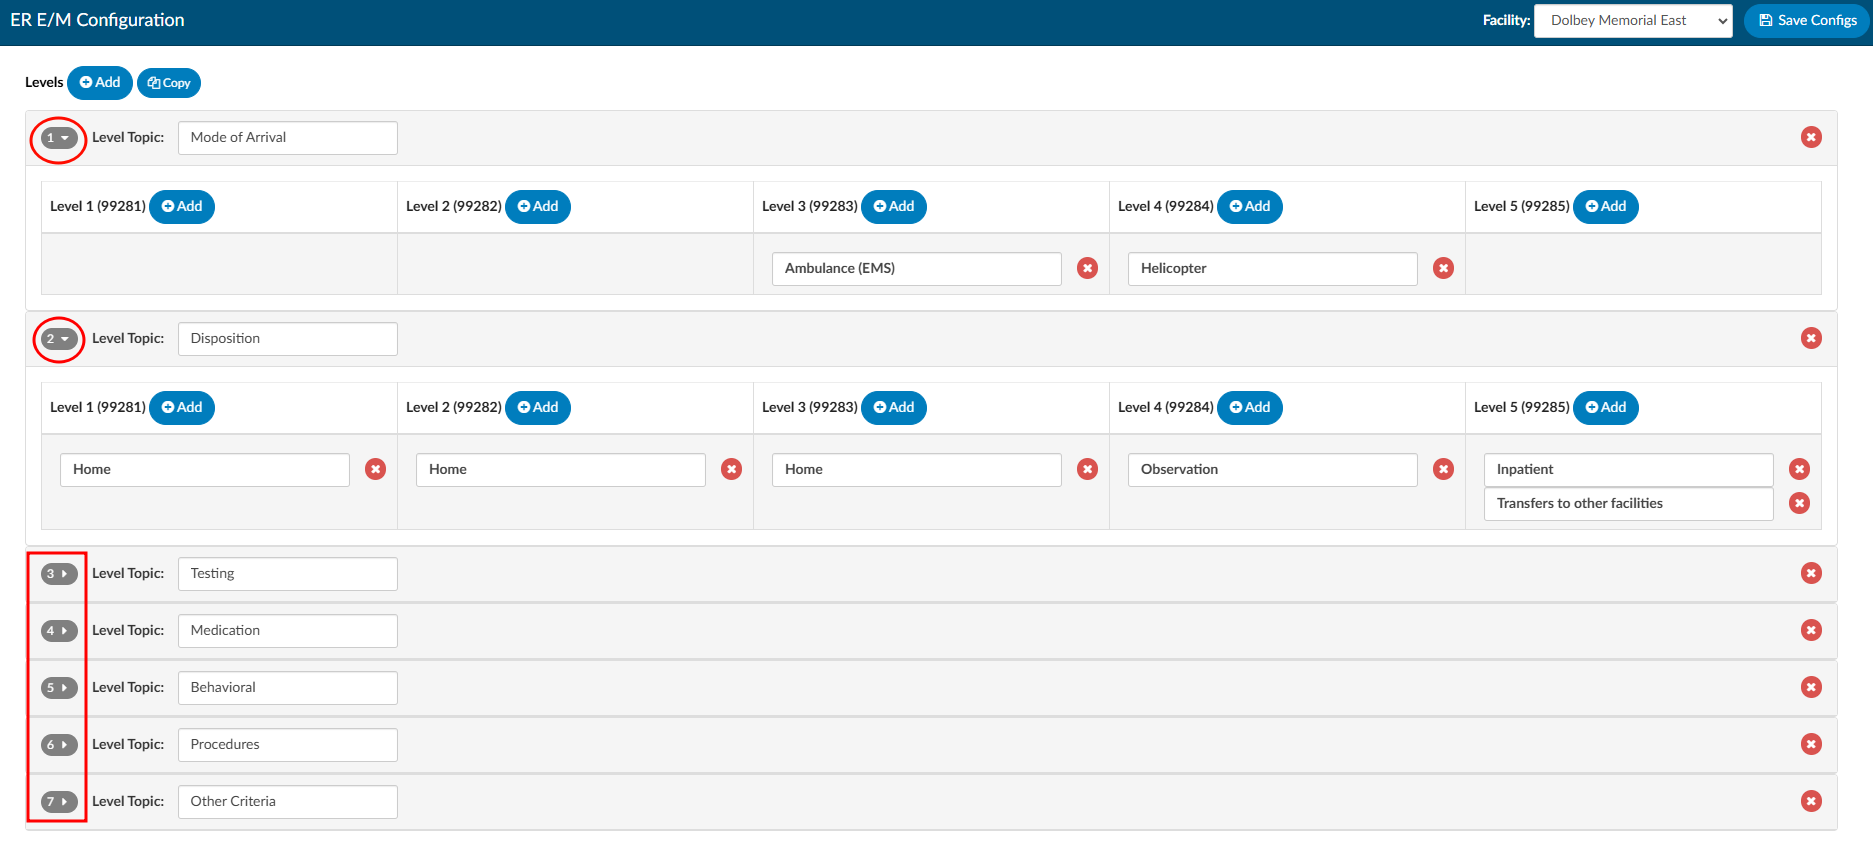
After expanding the topic, users will see each E/M Level along with its corresponding codes. Next to each level is +Add. Clicking this button allows for the addition of a new level item.
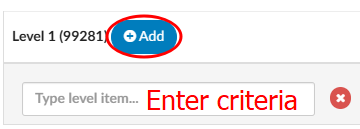
To remove any criteria selections, under each topic and level, simply click on the X button next to the criteria.
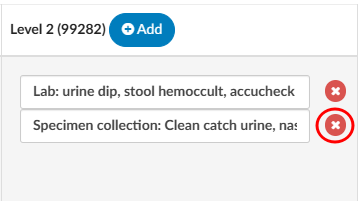
To change or udpate the verbiage of the criteria selection, place the cursor into the level item field and change the text.
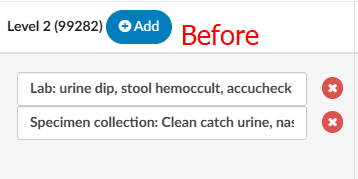
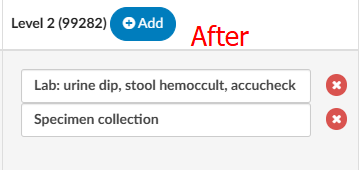
Configuring Charging Options and CDM
Below the E/M Level matrix configuration is a section for “Other”. The “Other” section allows for the addition of charging components attached to the facility’s charge master. To make changes to the default, click on the grey number to open the charge and CDM configuration.
The Effective Date field specifies the date when the CDM Table and its associated new charge(s) will take effect. This feature allows updates to the CDM Table to be scheduled, ensuring that future changes are staged and ready for the Coding Team when needed.
Updating the CDM
Copy and Paste
Click on the green “Edit CDM Table” button to the right of the effective date.

CDM columns can be copy and pasted directly into the “Edit CDM Table” window from an Excel spreadsheet.
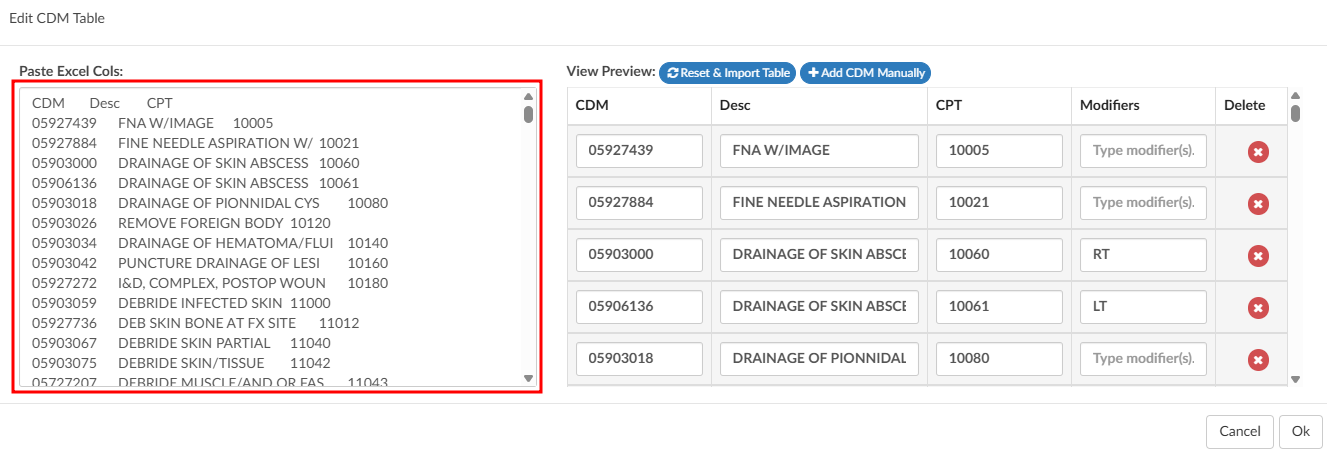
Best practice is to paste in the column for the CDM code, then the description, and finally the CPT code. This step is
extremely important because any assigned CDM code will need to be sent in the outbound interface. Therefore, the CDM table in Fusion CAC needs to match whatever system is downstream
After the information has been correctly updated, click Ok to continue.
Manually
CDM codes can be updated manually by clicking +Add CDM Manually.

This will create a new row with free text fields to add the CDM code, the description, and the CPT code.
Modifiers
The Edit CDM Table supports modifiers as part of the CDM import process.
When importing the CDM table, modifiers should immediately follow the CPT code with no space (for example, “30903RT”).

The Modifier column will be populated automatically when performing a Reset to import the spreadsheet, or can be entered manually.
When a coder assigns a CPT code in the E/M Viewer that matches a CDM entry with a modifier, the modifier will automatically be applied to the charge. This allows sites that use hard-coded modifiers such as RT or LT on specific charges to have those modifiers carried forward without requiring coders to add them manually.
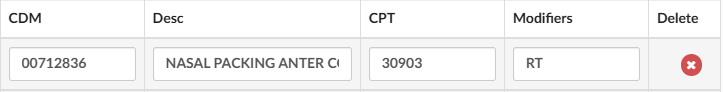
If the CPT code matches a CDM entry but the modifiers do not align, a warning will be displayed. Note that modifiers present on the assigned CPT code take precedence over modifiers defined in E/M Configuration via the Edit CDM Table feature.
Once the CDM table is populated, categories can be edited within the “Option” section. The default options are:
- Trauma
- No charges
- Medication quantity
- Medication time/modifier
- Additional charges
Like the E/M Level matrix, these categories can be customized to best fit the facility’s needs.
To edit an option, click the gray date tab to open the options and make changes. If certain options are not relevant, remove items under those sections simply by clicking on the RED.X
. Once emptied, the section will no longer for your users.
Options: Trauma
Expanding the trauma section will display several items by default. Each item has a CDM attached per E/M level, including critical care. Ensure that the CDM underneath each of the levels corresponds to what the CDM table indicates.
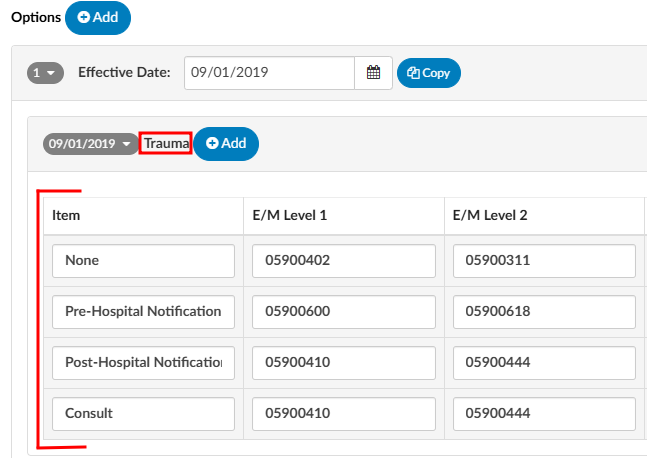
For end users, this will appear as a dropdown menu in the E&M Coding viewer. Based on the matrix and their selection, the system will automatically populate the corresponding CDM code associated with the assigned level.
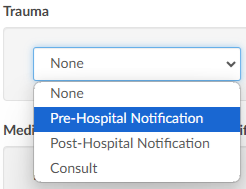
Update With CDM
If your CDM changes, this table needs to be updated as well.
Options: No Charge
Clicking on the gray date next to No Charge will exapnd the section. The “Item” field will be the verbiage that corresponds to the CPT code in the CPT column to the right of the Item column.
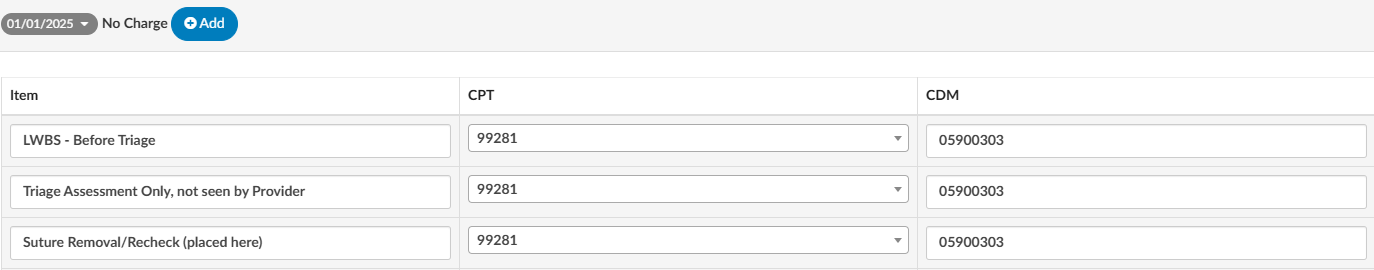
For end users, this will appear as a dropdown menu in the E&M Coding viewer. The user will choose the item and the outbound interface
will contain both the CPT code and the corresponding CDM code listed in this table.
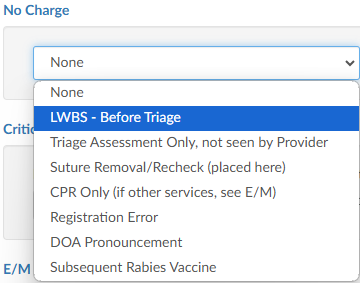
Options: Medication Quantity & Medication Time/Modifier
Click on the gray date next to Medication Quantity to expand the section. Item names, for which Dolbey provides default descriptions, can be listed here. These items will align with their corresponding CPT and CDM codes.
The medication sections are not about the medication, but rather the way the medication was administered. This allows organizations to charge for any injections, infusions, IV pushes, immunizations, and hydration. The medication administration quantity allows facilities to define how many
of each occurred on a particular date, if the ER visit occurred over more than one day, and other modifiers as needed.
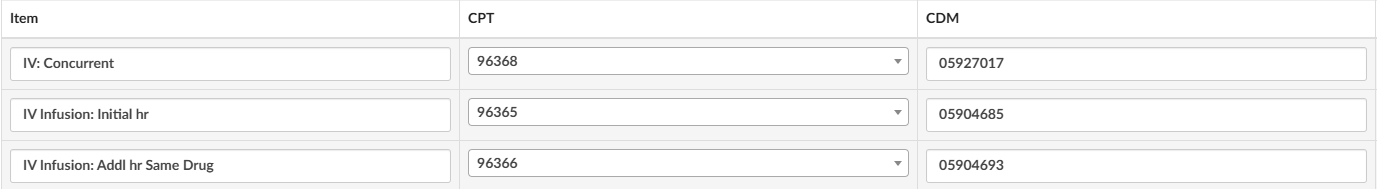
Medication Time/Modifier includes the ability to indicate that multiples of an item exist on the account. If there are different drugs involved, the user can copy the individual lines and add in the durations of each medication along with the date and modifier if the modifiers, if appropriate.
To the end-user, this will be a table where they can pick all the medication administrations to apply and provide dates and modifiers in the E&M Coding viewer. There is also a section end users to enter a note to keep everything in line so that they can indicate which medications they have already charged for. This helps the end user stay organized while providing information in the event of an audit.
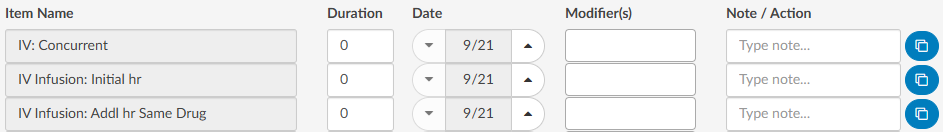
Some organizations like to have Medication Quantity and Medication Time/Modifier. Other organizations choose to relocate all of the items within the Medication Quantity to the Medication Time/Modifier section so that all medications are within the same section.

Options: Additional Charges
Addtional Charges is often a list of items commonly charged in the ER. The default list includes:
- Voiding Cystogram
- Insert Foley (Simple)
- Change Cystostomy (Simple)
- Temporary External Pacing
This list can be modified to best the needs of the organization.


Items listed in this section will align with their corresponding CPT and CDM codes.
To the end-user this displays as a table where they can quickly add a quantity, date, and modifier as applicable.
Note
The CPT Code field for “Additional Charges” is optional, as some organizations use charges without an associated CPT Code. The CDM field is mandatory for all Additional Charges, and CPT Codes are required for all other E/M charge types. When an Additional Charge without a CPT Code is added to an account from the E/M Viewer, it will be added to the E/M Summary normally without generating an error.
Grid Column Configuration
Grid Column Configuration is an administrative tool used to identify the columns to be displayed in Account List, Account Search, Calendar Stats, and Dashboard pages. Columns can be set to display per default user roles: Coders (incl Physician Coder, Single Path, and Auditor) and CDI.

All columns added in Grid Column Configuration will appear in Account Search, and selected columns can be made visible on other pages by checking the appropriate box.
The order of the fields in Grid Column Congifguration determines the default order of columns elsewhere in the applicaiton. Each user can then rearrange the column order on specific pages per their preference. Changes are saved automatically on the Account List page, while on Account Search, Calendar Stats, and Dashboard, users must save their adjustments manually.
Add/Remove Column
To add a column, click +Add New Column in the top right of the screen. The new column will appear as the bottom of the list.
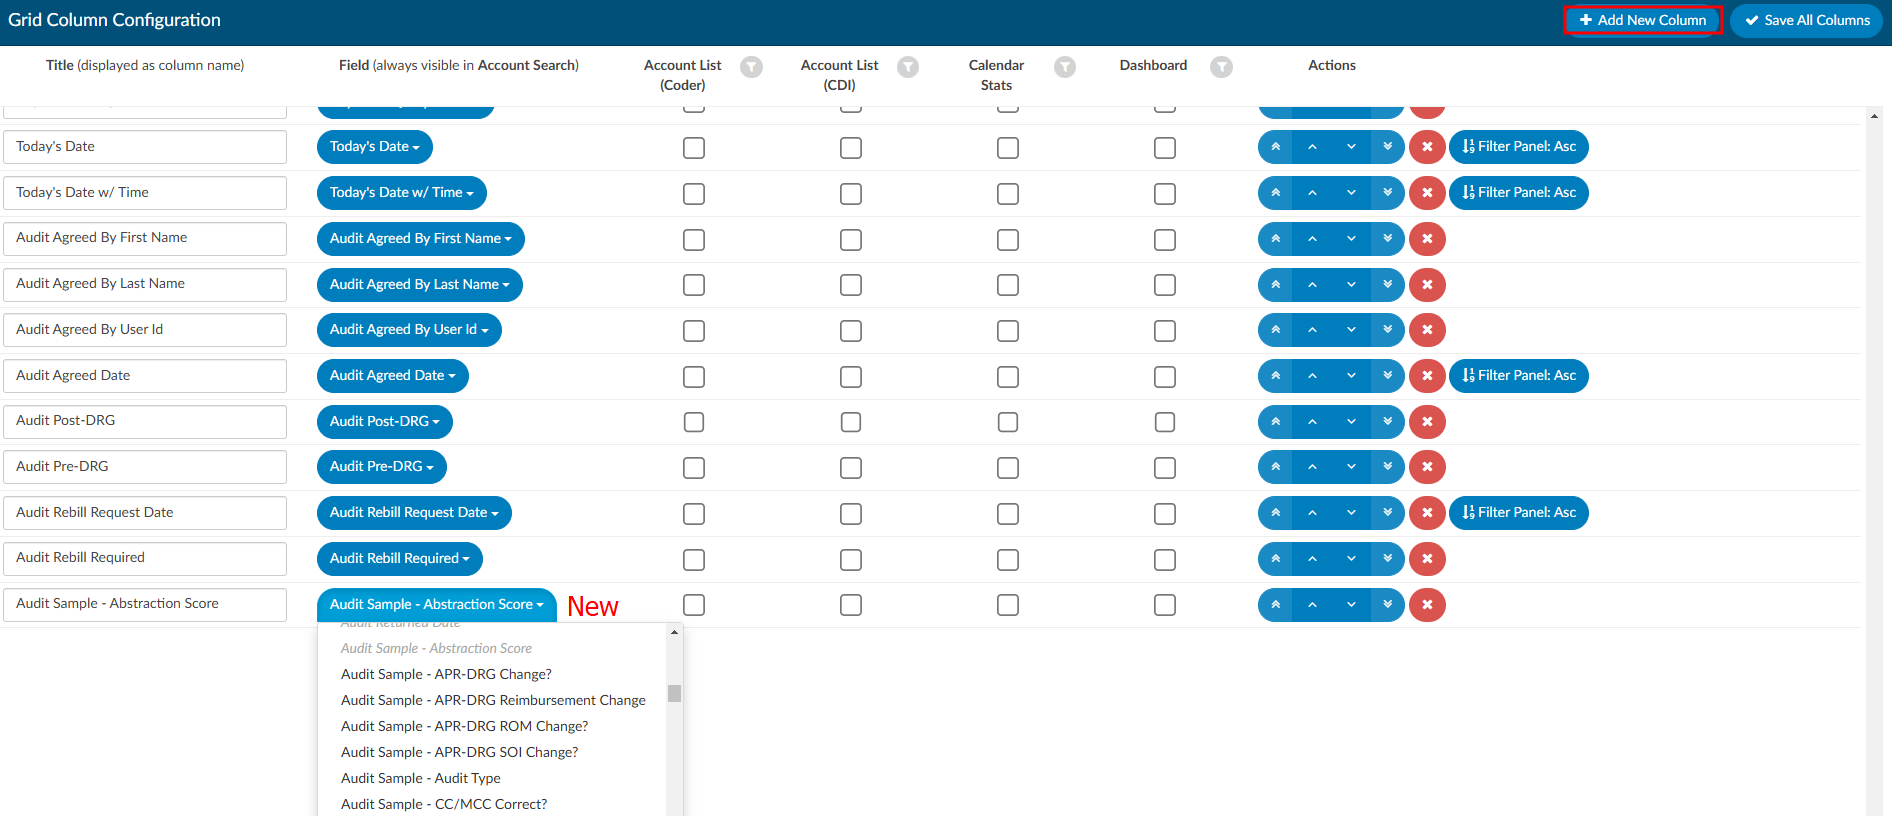
Select the field to be added from the dropdown options. Field names that are italicized and grayed out have already been added as a column. By default, the field name will populate in the Title box to the left of the blue dropdown. The title acts as the friendly name that will be displayed to end users. Titles can be changed to best fit the terminology used by the organization.
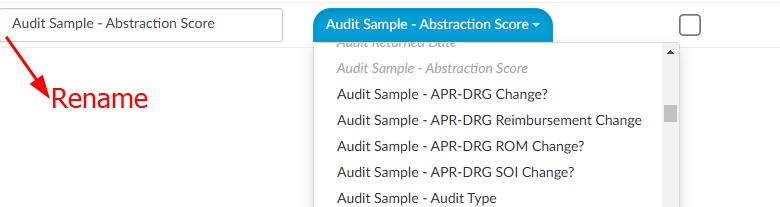
To the right of the field name are four checkboxes. These allow configuration as to which pages (Account List, Calendar Stats, and Dashboard) will display the column(s).
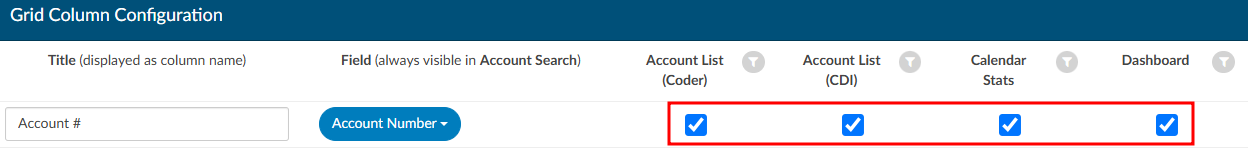
Actions buttons for each column can be found on the right side of the screen.
| Action Button | Description |
|---|

| Double lined up and down arrows will jump the column to either the top or bottom of the list |

| Single line up and down arrows will the column up or down one space |

| The red X will delete the column from the application |

| Date columns can be filtered to display in ascending or descending order by default |
Clicking on the “Filter” button will quickly show what columns are being used for which pages in the application.
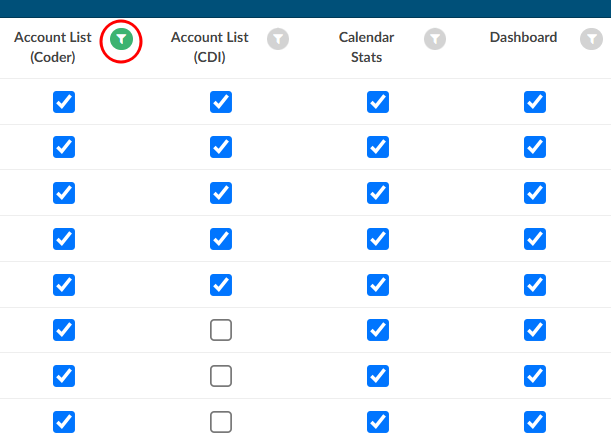
Mapping Configuration
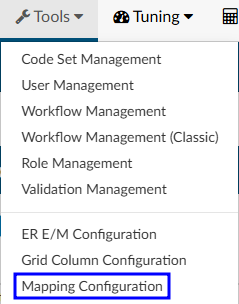
Mapping Configuration is an administrative tool designed for users with an administrative role, enabling them to map data field names to user-friendly, end-user-facing names.
Note
Avoid modifying data mapping tables in a production environment unless you have received proper training.

Export to CSV on the right-hand side of the the mapping title bar will export the selected mapping table to CSV should the table(s) need to be reviewed outside of the application.
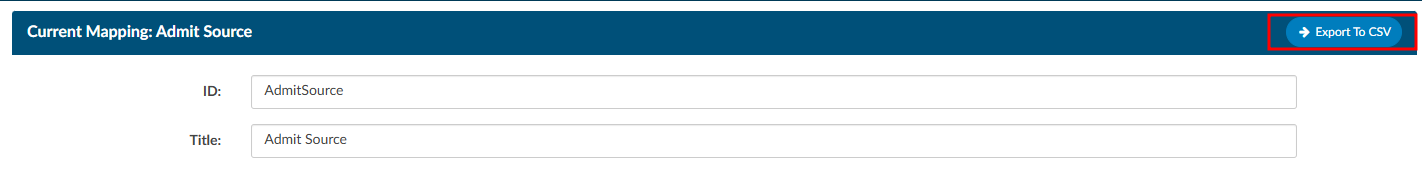
New Mapping Table
A new mapping table can be added by clicking +Add to the right of Active Mappings.

Each mapping table must have a unique ID and Title.
- The ID: is how the mapping table is identified by the application. It cannot contain spaces or symbols.
- The Title: is the user friendly name for the mapping table.
The ID and Title will often match, but the Title tends to be nicer for users to read as it can contain spaces.
Editing Mapping Tables
Click on a table title from the list of Active Mappings. Not every table contains the same information, but for the majority of the tables, the fields that can be updated include the key and the description.
- The Key is a unique value for that entry in the database
- The Description is the friendly value that will be displayed to users.
The Key and Description may or may not match. An example of when they differ is the “Stage” mapping table where the key value of “P” equals “Unbilled”.
To add values to the mapping table, click +Add New… to either the top or bottom of the list as desired.

Table values can be sorted by Ascending or Descending order using the arrow buttons.
Each value can be individually moved using the “Action” buttons.
Table rows can also be reordered by clicking the white space in the desired row, dragging, and dropping it in the new location.
Some tables can be removed by clicking the red X in the Active Mapping list.
If a mapping table does not have a red X to the right of its title, that means it is a default mapping table that cannot be removed from the system.
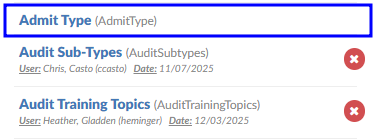
Special Mapping Columns & Tables
While many of the mapping tables are set up the same way, several are unique and have more fields available to edit.
Audit Training Topics
The Account Type column in the AuditTrainingTopics mapping allows administrators to specify whether each audit training topic is available for all accounts, inpatient accounts only, or outpatient accounts only. When an auditor is working on an inpatient account, only training topics designated for all accounts or inpatient accounts will appear as selectable options, and likewise for outpatient accounts.
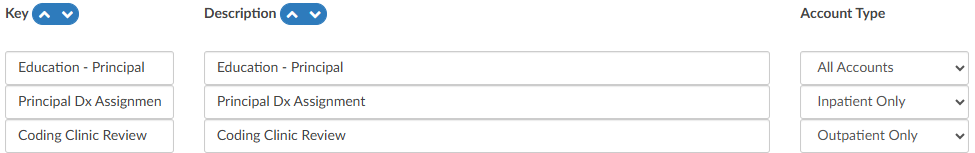
This feature applies to Audit Management only and is not implemented in CDI Audit Management, as CDI audits are exclusively applied to inpatient accounts.
Category Mapping:
Incentive Multiplier
Incentive Multiplier allows administrators to optionally record an incentive multiplier that is used in the Incentive Productivity Report. Categories without a value in this column will be calculated with an incentive multiplier of 1.0.
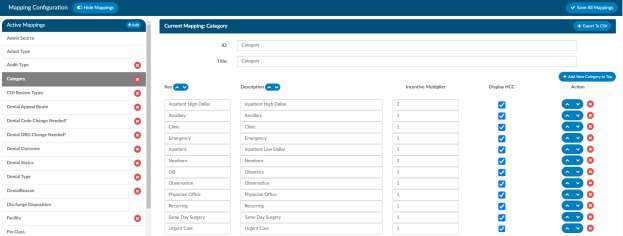
The Incentive Productivity Report reports on whole weeks, but only produces an entry if the coder first submitted an account that week. This report pulls its data in real-time.
Display HCC Indicators
When the user assigns a code that has a CMS HCC, a small H indicator appears.
- The current version of HCC and the version for the previous calendar year (retroactively) will display when the user hovers over the H in the Assigned codes tree.
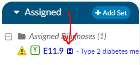
The Previous HCC Overview will be available in the Navigation tree for any subsequent patient chart with the same MRN number that previously had HCC’s.
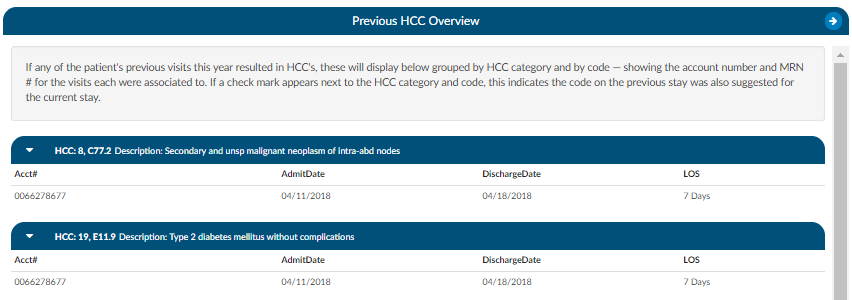
Current HCC Total will be captured for each chart and is viewable in account search.
HCC Indicators Are Not Retroactive
HCC data that existed prior to enabling this feature in the mapping table will not be captured.
Pending Reasons Mapping:
Administrators can specify the facilities, categories, or roles each pending reason applies to. Alternatively, these fields can be left blank to apply the pending reason universally.
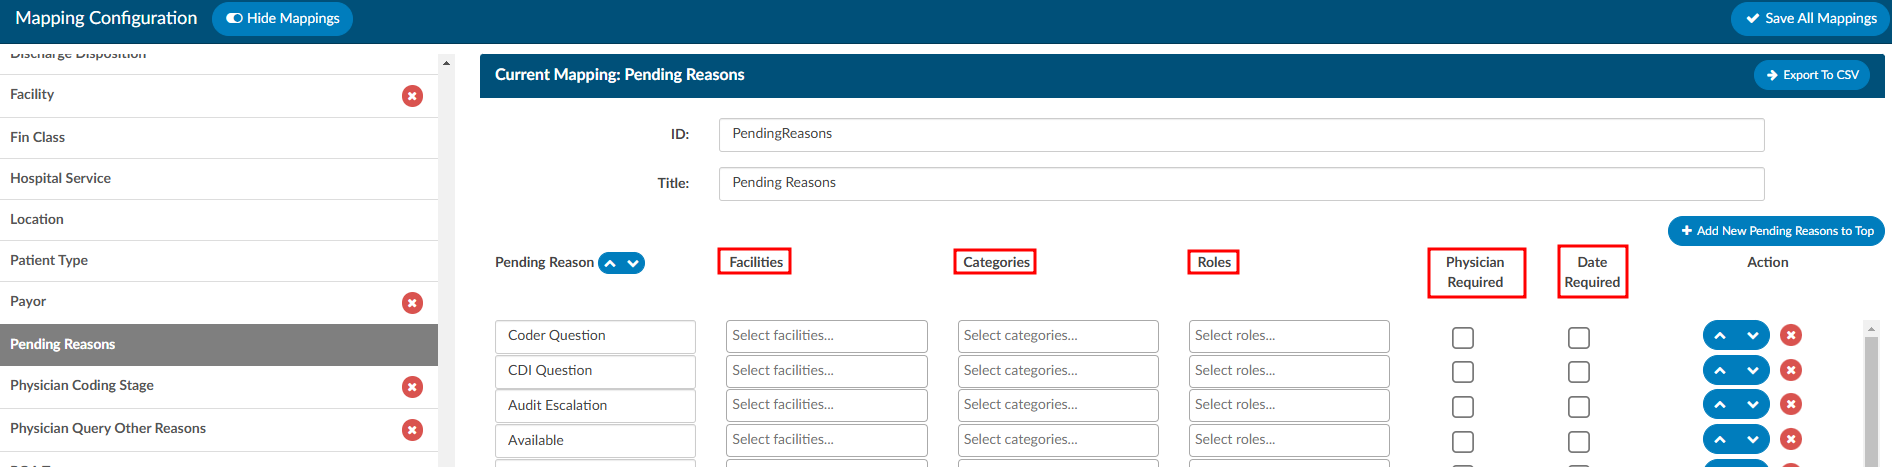
When a pending reason has the Physician Required box checked, the user will be prompted for a physician when that pending reason is assigned to an account. The selected physician will appear on the Code Summary page and in the Pending Reasons report.
Additionally, there is another checkbox to indicate a date is required, when applicable.
CDI Review Types Mapping:
CDI Review types are custom and not enabled at every organization. Additional information on the use of custom reviews can be found here.
Note: Changing Existing Types
Changing an existing CDI Review Type will change reporting and dashboards.
Payor Mapping:
The “Days to Bill” column indicates how many days are left to bill the payor.
A default value can be set, which will apply to any payor in the mapping table without a specified value in the “Days to Bill” column.
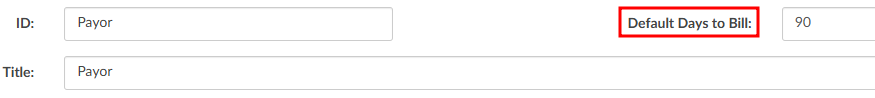
Each payor can have a unique number of days to bill
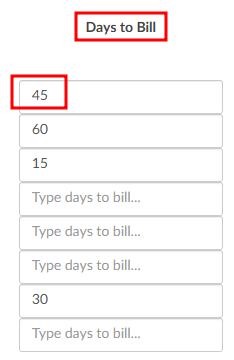
The billing date is compared to the current date (or the last submitted date if the account has already been submitted) to calculate the “Billing Countdown,” which represents the number of days remaining to submit the account. If an account has no payor, no matching payor mapping, or a payor mapping without a value in the “Days to Bill” field, the “Default Days to Bill” value is used. If the “Default Days to Bill” field is blank, a value of zero is applied.
A “Billing Countdown” field can be added from Grid Column Configuration to use
for account search filters and workflow. See a use case for this workflow in the screenshot below:
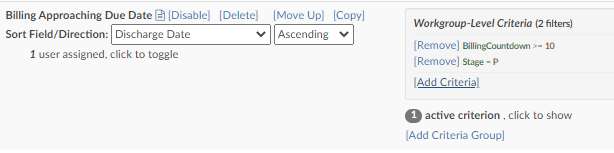
Query Reasons (PhysicianQueryReasons)
The mapping of PhysicianQueryReasons now has a column called Roles, which will allow the user to assign reasons to specified roles.
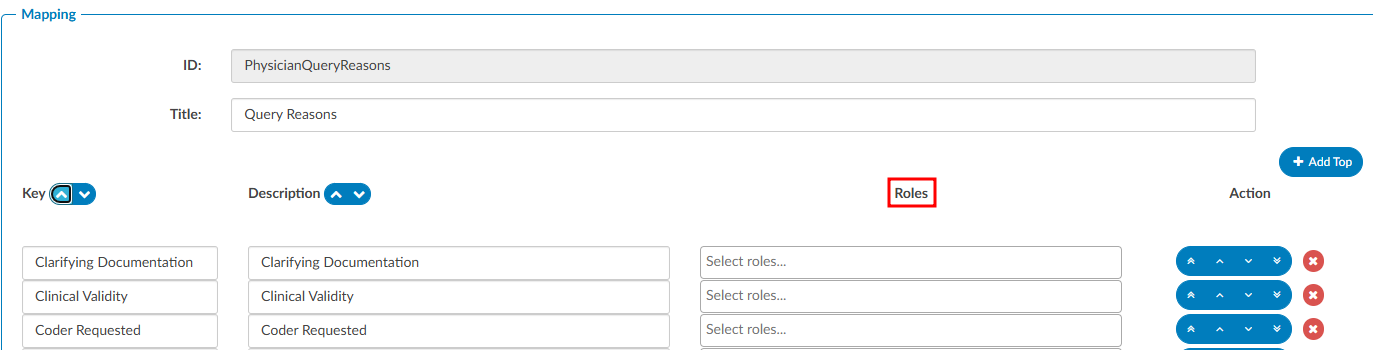
Show History
A “Show History” button appears in the upper right corner of any mapping table that has been modified. Clicking it opens a dialog displaying a before-and-after comparison of all changes made to that mapping, listed in reverse date order. Additions are highlighted in green, deletions in red, and changes in yellow, making it easy to quickly identify exactly what was modified and when.

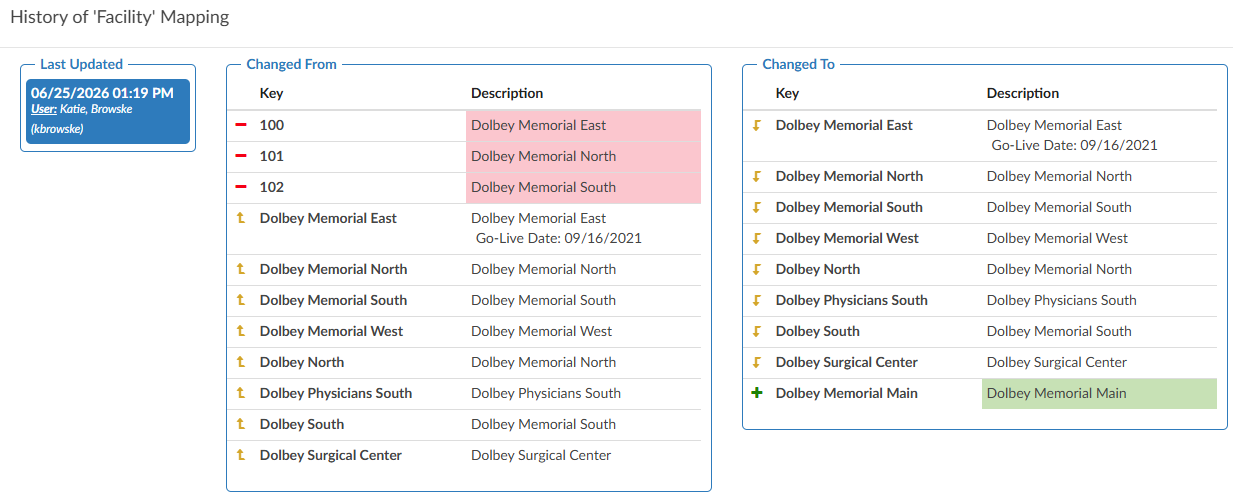
Notifications Management
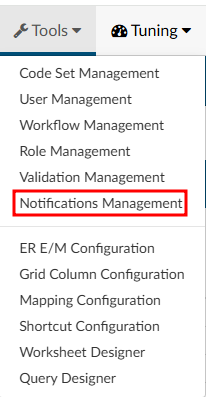
Notifications Manager, found in the Tools dropdown menu, allows users with an Administrative role to create notifications that will alert other users of anything they may need to be aware of within the system and/or organization. The notifications can be added to the CAC login screen, the Dashboard, or both.
Adding a Notification
To add a new notification, select Notification Manager from the Tools dropdown menu, then click on +Add Notification. Fields will become available on the screen to allow the user to build out the notification.
- Title - Name the alert with a brief title.
- Description - Add more detials to the title with a description of what the users should exepct as a result of the notification.
- Style - The notification can be displayed in a color that will draw yhe user’s attention.
- Start and End Date - Each notification can have a start and end date. If there should be no end date to the notification, simply keep the End Date blank.
- Location - Where the notification will appear. It can either be on the login screen, Dashboard, or both.
- Role(s) - If desired, the notification can be directed to a specific user role or roles IF the Location is set to Dashboard only.
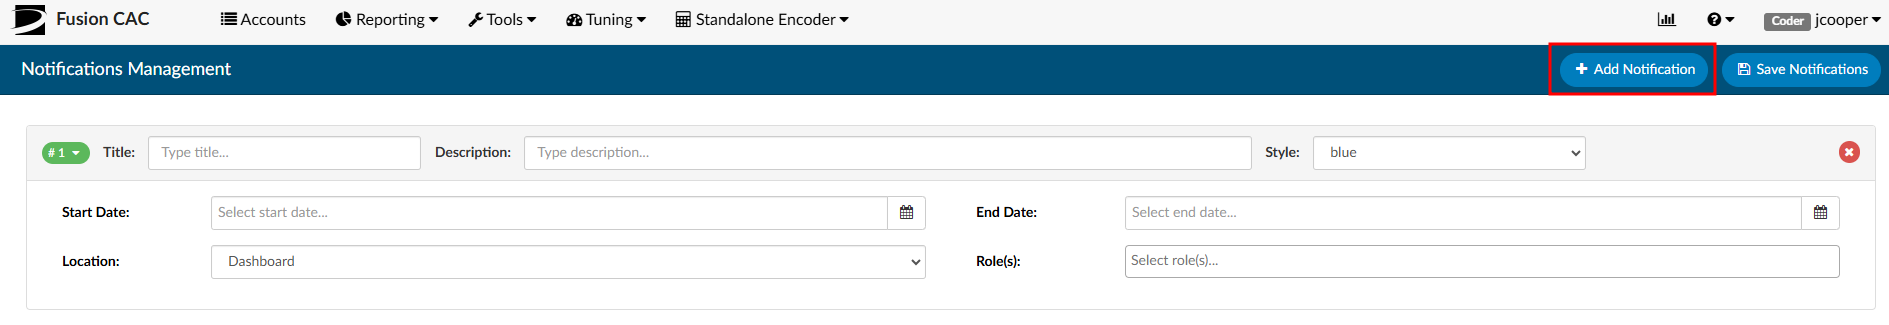
There can be multiple notifications and each will be numbered. To collapse the details of the notification, click on the number icon and it will hide the information. If a notification is no longer needed, the user can delete the notification by clicking on the RED X . When a user is done adding or making changes to a notification, click Save Notifications.
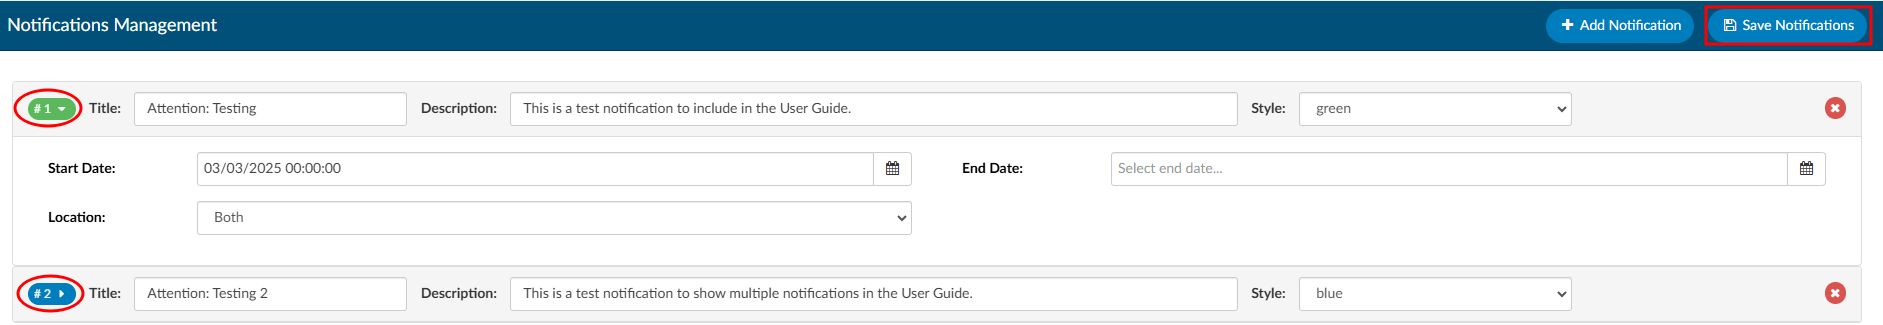
Viewing a Notification
Notification on the login screen:
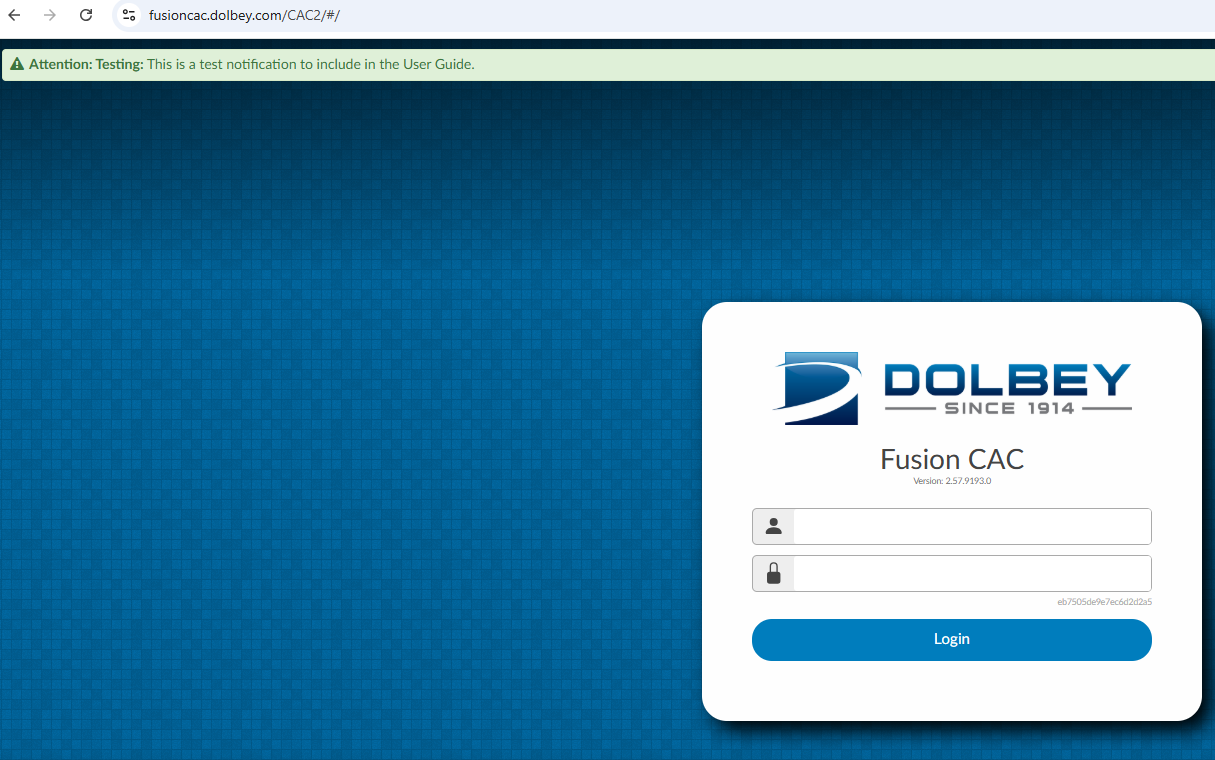
Notification on the Dashboard:
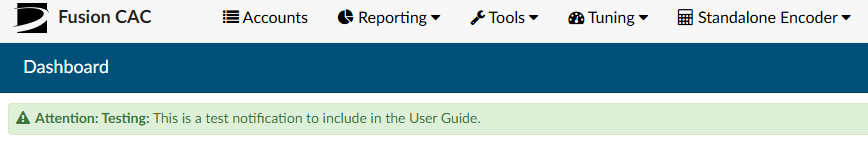
Multiple Notifications:
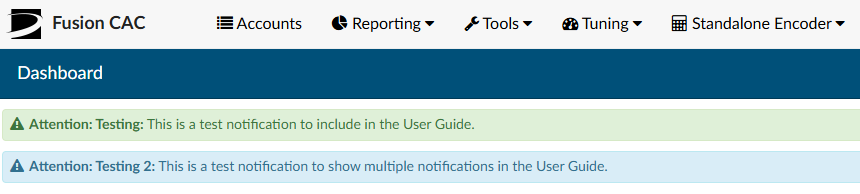
Worksheet Designer
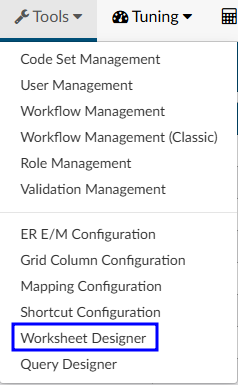
Worksheet designer is used to create custom worksheets for users, which are used to collect data and/or take notes.
Access to worksheets can be restricted by user role:
- Audit
- CDI
- Coding
- Physician Coder
Alternatively, worksheets can be shared. A Shared Worksheet is a worksheet that can be utilized by Auditors, CDI Specialists, and Coders unlike the “CDI Worksheet” and “Coder Worksheet” which are exclusive to CDI and Coding, respectively.
Creating a New Worksheet
To add a workheet, simply click on the +Add button in the desired section.
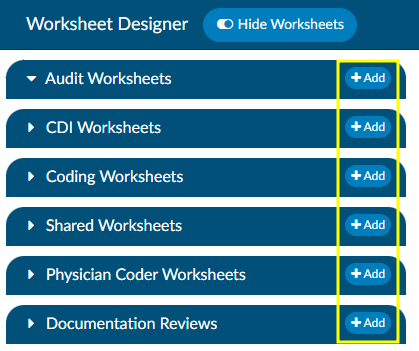
A blank template will appear on screen. The first step is to enter a unique a document name. Each worksheet must have a unique name for reporting purposes. A document name must exist before the template can be saved.
Renaming a worksheet
Once a worksheet name has been saved, it cannot be edited. To rename an exisitng worksheet, please see the Source Code section below or contact the SME Team (smeteam@dolbey.com).
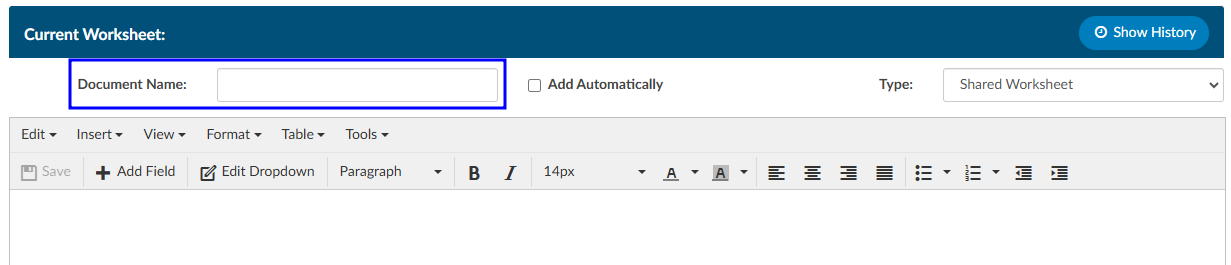
To start with a document that has already been created, copy the text and paste it into the form
designer. Changes to the formatting may be needed once pasted depending on the original document format.
Text copied or typed directly into the worksheet will be read-only for the end user(s) working with the form. This text is often used as labels and to direct users on completing the template.

The Roles field is available on CDI, Coding, and Shared worksheets. When one or more roles are assigned to a worksheet, only users who have at least one of those roles assigned to their profile will be able to add that worksheet to an account. Users without a matching role will not see the option to add the worksheet, though they will still be able to view worksheets that have already been added. This role restriction is based on the full list of roles assigned to a user’s profile, not just the role they are currently signed in under.
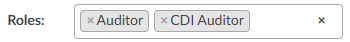
The Roles field does not apply to Documentation Review or Physician Query templates and will not appear for those template types.
Adding Fields
Fusion CAC offers several types of fields that can be added to worksheet templates. These fields allows end users to enter information into the worksheet once it has been added to an account.
Add a new field by clicking +Add Field in the template tool menu.

Field Type


A single input field allows the end user to free type text. This field is best used for entering a concise amount of information, such as a name or short series of numbers. The box will grow horizontally as the user types to fit the data entered.
Multiple-Line Text

A multiple-line text field allows the end user to free type text. This field is often used for entering a large amount of information, such as taking notes or providing detailed comments. The box will grow vertically as the user types to fit the data entered.
Checkbox
A checkbox allows the end user to indicate certain items are applicable. This field has been used to show that the worksheet is complete or as a way for users to select certain action items.
Date/Datetime


These fields allow the end user to indicate the date and time of a response, test, or other item being tracked.
Dropdown

Dropdown menus allow end users to select from a pre-determined list of options.
After naming and determining who can edit the field, a dialog box will open to set the options in the dropdown menu.

Dropdown items can be edited by pulling up the template in Worksheet Designer and clicking Edit Dropdown in the template tool bar.
Account Field
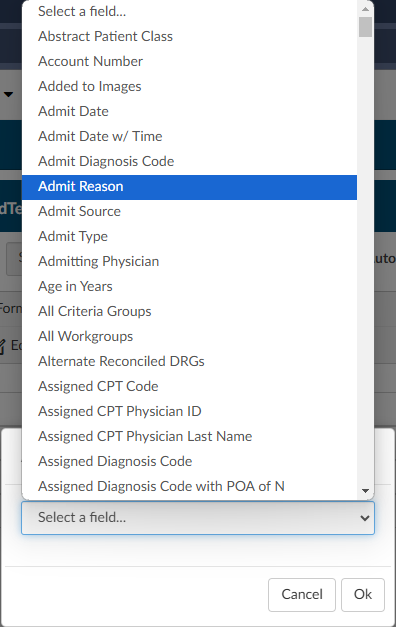
Account fields will automatically populate information from the account, if it has been sent to Fusion CAC. Auto-populated account information will be displayed in a bolder font to differentiate it from text manually entered by an end user.

Field Name

Each field should have a unique name for reporting purposes.
Field names can repeat across worksheets, but each field on a worksheet must be unique. If a field name is repeated on a worksheet, whatever is entered into one field will be automatically duplicated into the other fields with the same name on that worksheet.
Editable
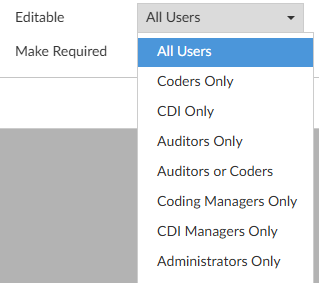
Individual fields can be locked down per user role. This way Auditors, CDI Specialists, and Coders can add and view a shared worksheet to a chart, but only users with the specified role can edit certain fields. All users will be able to see the information in that field, but only the specified user role can edit the field.
Make Required

Fields can be made required by checking the box. Leaving the box unchecked means the field is optional and the worksheet can be completed even if that field is left blank.
When a worksheet is added to a chart, required fields will have a light red background to indicate action must be taken. Addiontally, the user will be presented with a red toast message if they try to save the chart without completing all required fields. The toast message will include the fields that need to be completed.

Clicking OK, will add the selected field to the template with the specified settings. A box will then display in Worksheet Designer as a
placeholder for the selected field with the field name. The fields are not interactive from Worksheet Designer. Once a worksheet has been added to a chart, the field name will be replaced with instructions for the end user.
Show History
Worksheet Designer will create a history for changes made to templates in Worksheet Designer. Once a change is
made on a template and saved, Show History will appear in the top right of the worksheet. Clicking
on it will bring up a notes box, just like in Workflow Management.

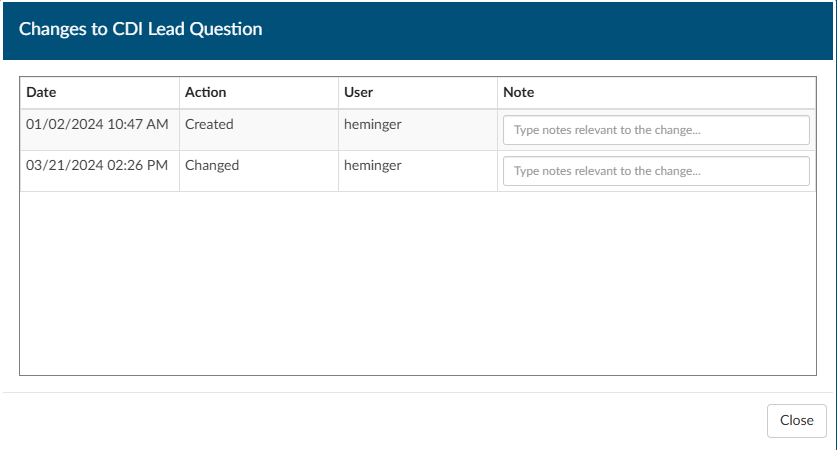
Source Code
The template source code can be found under the Tools menu within the template tool bar. The source code is the programming language that tells the application how to display the worksheet. It may be overwhelming to look through, but can be helpful in making quick edits to worksheets.

Changing Field Width
By default, fields will take up the full width of the template. The width can be reduced in the source code to best fit formatting needs.
In the example below, the width of the dropdown menu has been modified so that it can be on the same line as a checkbox and a multi-line text box.
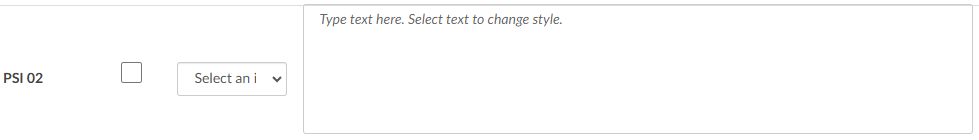
This was done by opening the source code, finding the name of the field, and changing the width percentage.
Renaming/Moving a Worksheet
Once a worksheet has been named and saved, the Document Name cannot be edited. This is intentional for accurate reporting. If a worksheet needs to have a new name, the simplest way to change the name is to copy the source code into a new template and give that template the correct name. Copying the source code will bring over the whole body of the worksheet as is, so the only thing that needs to change is the document name.
- In worksheet designer, open the template to be copied/renamed
- Open the template’s source code
- Select all the text in the source code box
- This can be done by clicking and dragging to highlight or with the keyboard shortcut Ctrl + A
- Copy the source code
- This can be done by right-clicking in the highlighted text and choosing copy or with the keyboard shortcut Ctrl + C
- Click Ok to close the source code window
- Add a new worksheet in the desired section
- Open the template’s source code
- Paste the copied source code into the box
- This can be done by right-clicking and choosing paste or with the keyboard shortcut Ctrl + V
- Click Ok
- Enter a new document name and Save
Click the red X button to remove the original worksheet so it can no longer be used. The deleted worksheet will still show up on accounts it was added to prior to being deleted, but users will not be able to add it to new accounts.
This method also allows for an existing worksheet to easily be re-catagorized by role.
If you have any questions or would like to walk through editing source code with someone, please reach out to the Dolbey SME team (smeteam@dolbey.com).
Query Designer
Query designer is used to create custom queires per organization. Query templates are frequently created and saved as a base template with most of the query written to show as read only text. The creator can then add open fields for the end user to add additional questions to the base query template.
Access to queries can be restricted by user role:
- Audit
- CDI
- Coding
- Physician Coder
Alternatively, queires can be shared. A Shared Query can be utilized by Auditors, CDI Specialists, and Coders.
Creating a Query
To add a query, simply click on the +Add button in the desired section.
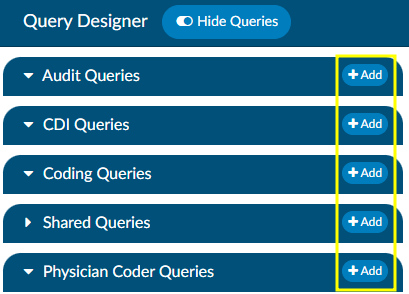
A blank template will appear on screen. The first step is to enter a unique a document name. Each query must have a unique name for reporting purposes. A document name must exist before the template can be saved.

Renaming a Query
Once a query name has been saved, it cannot be edited. To rename an exisitng query, please see the Source Code section below or contact the SME Team (smeteam@dolbey.com).
To start with a document that has already been created, copy the text and paste it into the form
designer. Changes to the formatting may be needed once pasted depending on the original document format.
Text copied or typed directly into the query will be read-only for the end user(s) working with the form. This text is often used as labels and to direct users on completing the template.

Adding Fields
Fusion CAC offers several types of fields that can be added to query templates. These fields allow end users to enter information into the query after it has been added to an account.
Add a new field by clicking +Add Field in the template tool menu.

Field Type
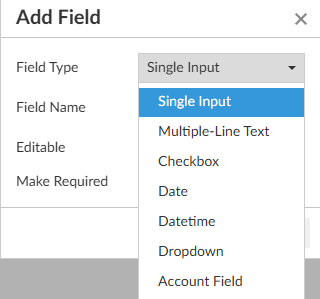

A single input field allows the end user to free type text. This field is best used for entering a concise amount of information, such as a name or short series of numbers. The box will grow horizontally as the user types to fit the data entered.
Multiple-Line Text
A multiple-line text field allows the end user to free type text. This field is often used for entering a large amount of information, such as taking notes or providing detailed comments. The box will grow vertically as the user types to fit the data entered.
Checkbox

A checkbox allows the end user to indicate certain items are applicable. This field has been used to show that the query is complete or as a way for users to select certain action items.
Date/Datetime
These fields allow the end user to indicate the date and time of a response, test, or other item being tracked.
Dropdown

Dropdown menus allow end users to select from a pre-determined list of options.
After naming and determining who can edit the field, a dialog box will open to set the options in the dropdown menu.
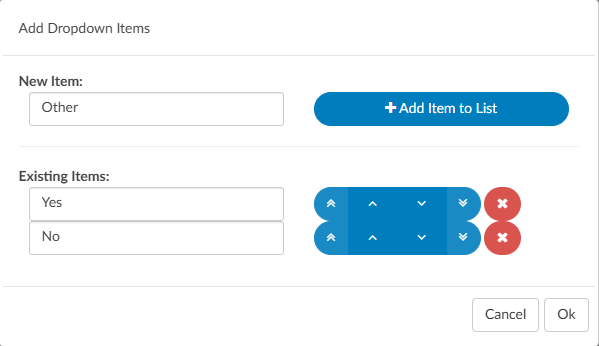
Dropdown items can be edited by pulling up the template in Query Designer and clicking Edit Dropdown in the template tool bar.
Account Field

Account fields will automatically populate information from the account, if it has been sent to Fusion CAC. Auto-populated account information will be displayed in a bolder font to differentiate it from text manually entered by an end user.

Sections
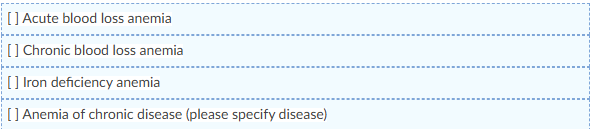
Sections allows end users to customize the query by removing sections as needed from the template or to rearrange the order of information.
Static text and fields can be inserted into a section, however sections cannot be inserted in other sections.
When the query is added to an account, each section will show have arrows so the end user can re-order as needed. Sections will also have a X to remove that section from the query. Once a section has been removed, an undo button will become available to place it back into the query.
Physician
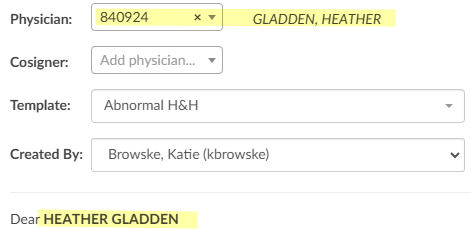
The physician field will auto-populate the name of the physician being sent the query, if the information is available.
Field Name
Each field should have a unique name for reporting purposes.
Field names can repeat across queries, but each field on a query must be unique. If a field name is repeated on a query, whatever is entered into one field will be automatically duplicated into the other fields with the same name on that query.
Make Required

Fields can be made required by checking the box. Leaving the box unchecked means the field is optional and the query can be completed even if that field is left blank.
When a query is added to a chart, required fields will have a light red background to indicate action must be taken. Addiontally, the user will be presented with a red toast message if they try to save the chart without completing all required fields. The toast message will include the fields that need to be completed.

Clicking OK, will add the selected field to the template with the specified settings. A box will then display in Query Designer as a
placeholder for the selected field with the field name. The fields are not interactive from Query Designer. Once a query has been added to a chart, the field name will be replaced with instructions for the end user.

Creating Internal Notes
Internal notes can be added to query templates to provide a note for the end user only from the Insert menu in the template tool menu.
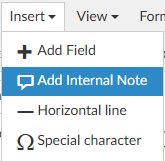
These notes are only displayed for the user filling out the query and is not set to the provider receiving the query. When adding a physician query the user will see the highlighted section in the query when that template is selected.
After sending the query, the internal note will no longer be seen unless the user has the privilege of “Edit Open Queries to Resend” in Role Management.
Blank Query Template

If a Physician Query has a document name of “Blank Query Template”, then an additional Add Input For ‘Query For’ field is automatically added for the user to enter plain text when the query is added to an account. This field cannot be removed from the Blank Query Template.
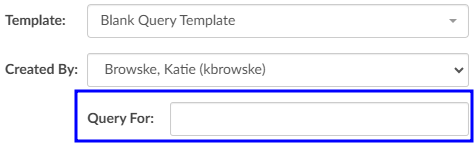
When the end users use this template, they will be presented with a box to free type the query topic.
In the following reports, the Query template column will show “Blank Query Template”: followed by the value for the ”Query For” field:
- Outstanding Queries
- Query Impact by Discharge Date
- Query Impact Report
- Query TAT by Author Report
- Query Template Volume Overview
Verbal Query Template
A verbal query template can be requested through CAC Support (cacsupport@dolbey.com). Scripting logic will be added so that when a template named “VERBAL QUERY” is used, the query will not be sent outbound to the provider.
For accurate reporting on the topics of the query, Dolbey recommends creating a template using the exact name “VERBAL QUERY” and selecting the check box Add Field For ‘Query For’ next to the document name.

When the end users use this template to record the verbal query outcome they will be presented with a box to free type the query topic.
Show History
Query Designer will create a history for changes made to templates in Query Designer. Once a change is
made on a template and saved, a Show History will appear in the top right of the query. Clicking
on it will bring up a notes box, just like in Workflow Management.


Source Code
The template source code can be found under the Tools menu within the template tool bar. The source code is the programming language that tells the application how to display the query. It may be overwhelming to look through, but can be helpful in making quick edits to queries.
Changing Field Width
By default, fields will take up the full width of the template. The width can be reduced in the source code to best fit formatting needs.
In the example below, the width of the dropdown menu has been modified so that it can be on the same line as a checkbox and a multi-line text box.

This was done by opening the source code, finding the name of the field, and changing the width percentage.

Renaming/Moving a Query
Once a query has been named and saved, the Document Name cannot be edited. This is intentional for accurate reporting. If a query needs to have a new name, the simplest way to change the name is to copy the source code into a new template and give that template the correct name. Copying the source code will bring over the whole body of the query as is, so the only thing that needs to change is the document name.
- In query designer, open the template to be copied/renamed
- Open the template’s source code
- Select all the text in the source code box
- This can be done by clicking and dragging to highlight or with the keyboard shortcut Ctrl + A
- Copy the source code
- This can be done by right-clicking in the highlighted text and choosing copy or with the keyboard shortcut Ctrl + C
- Click Ok to close the source code window
- Add a new query in the desired section
- Open the template’s source code
- Paste the copied source code into the box
- This can be done by right-clicking and choosing paste or with the keyboard shortcut Ctrl + V
- Click Ok
- Enter a new document name and Save
Click the red X button to remove the original query so it can no longer be used. The deleted query will still show up on accounts it was added to prior to being deleted, but users will not be able to add it to new accounts.
This method also allows for an existing queryt to easily be re-catagorized by role.
If you have any questions or would like to walk through editing source code with someone, please reach out to the Dolbey SME team (smeteam@dolbey.com).
Shortcut Configuration
Keyboard shortcuts are keys or key combinations allowing users to take certain action within the application without using their mouse. Some users find it more efficent to work without having to take their hands off the keyboard to use their mouse.
Many different applications use hotkeys and keys may already be mapped to different software solutions used by an organization. Dolbey allows hotkeys for Fusion CAC to be configured per organization. Default settings have been provided, but can be changed as needed by users with the role of Administrator.
To record a new hotkey combination, simply press the record button on the line of the function you wish to configure and enter in a key combination (usually 1-2 keys on the keyboard). Since Fusion CAC is a browser-based application, standard browswer hotkeys should not be used.