Subsections of Reporting
Account Search
Account Search is helpful for reporting when creating a report that is not in the default user reports. Account Search allows the user to search most data points to export the raw data into a CSV file.
Sample Use Cases:
- How many inpatient accounts were discharged last month with a pricipal diagnosis of sepsis?
- What accounts were discharged with pending reasons?
- Of the inpatient accounts coded and then discharged last month, what is the total of each CC and MCC?
To answer any of the questions above, the data will need to be filtered as Account Search can pull all account/chart data available in the system.
Setting Criteria
Account Search is highly dynamic in the types of data users can pull. Account Search, much like workflow, has two different options to create a filters using the AND/OR criteria.
- AND criteria
- OR Criteria
AND Criteria
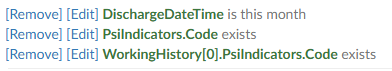
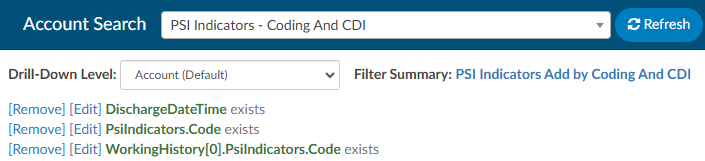
When using AND criteria, think about adding AND at the end of each criterion. For example, this criteria will cause the account search to display results if the patient chart had both the coder AND the CDI user identifying a PSI.
OR Criteria
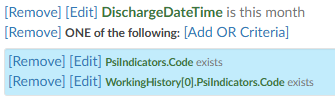
When using OR criteria, think about adding OR at the end of each criterion. The OR criteria will display in blue to differentiate between the first and second criteria that will trigger the results. For example, this criteria will cause the account search to display results if the patient chart had either the Coder OR the CDI user identifying a PSI.
Start to filter the data by clicking the appropriate criteria button and selecting fields to constrain the data.
Continue to constrain the data for the desired results. There are over 250 fields that can be used to constrain the data. Each organization will have their own custom fields, depending on how the system was configured.
Selecting Columns
Once the data has been constrained, select the columns to display by selecting Columns.
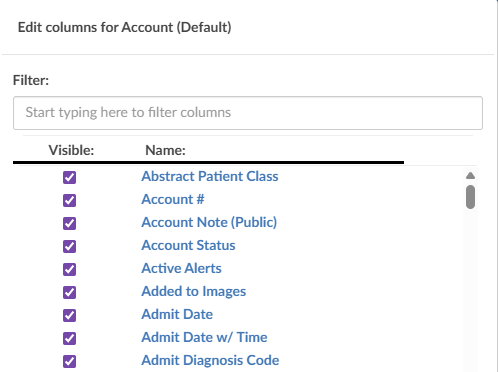
When the results are initially returned, there will be more column fields displayed than needed. Users can pair down the columns by removing or adding the columns as needed. Clicking on the drop-down arrow on Columns allows the user to select or unselect all columns. Use the check box to indicate the column should display and uncheck it to remove the column from the Account Search or Scheduled Account Search report. The filter box at the top of the list of columns will narrow down the available fields as the user types.
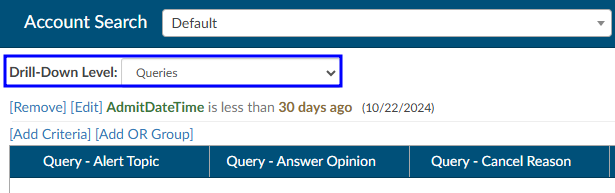
Drill-Down Level
Account Search allows for the ability to search for account level data or drill down to an array of different data collections.
- Account (Default)
- Audits
- CDI/Clinical Alerts
- Denials
- E/M Charges
- Final Assigned Codes
- Final CPT Codes
- Final Diagnoses
- Final Procedures
- Final Visit Reasons
- Pending Reasons
- Physician Coding Assigned Codes
- Physicians
- Queries
- Working Assigned Codes
- Working CPT Codes
- Working Diagnoses
- Working Procedures
- Working Visit Reasons
- Worksheet History
When a choice other than Account, which is the default view, is selected the columns for that choice are added to the beginning of the original grid. The drill-down level can be saved to the grid. For example, if there is search the user has saved called Unsubmitted, and the user added the Final Procedure drill-down to it, then when Unsubmitted is pulled up in Account Search it will include the drill-down columns. Additionally, the name of the drill-down will appear in the drill-down level field instead of the default of Account.
Searching for Data
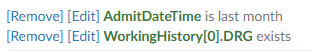
The data filter allows user to constrain the data before returning results in account search grid.
For example, a search for patient charts that CDI reviewed in the previous month might look like this:
To learn more about the fields and how they are defined, navigate to the Fields section in this user guide.
Sort and Filter Results
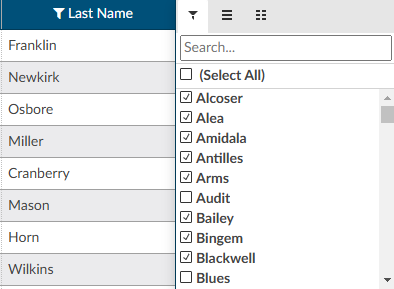
Each column has menu options to filter the data to restrict the view for only the data the user has defined.

To manually filter:
- Click the 3 lines on the column to be filtered
- Click on the Filter icon
- Check or uncheck the boxes depending on the data to be filtered
- Click on the filter to close the box
Additionally, users can choose to group the data creating a pivot table.
Using the data to create a pivot table allows users to reorganize the selected columns and rows of data in the account search grid table to obtain a desired report. The fields that can be filtered on and/or displayed can be found in the Fields section in this user guide.
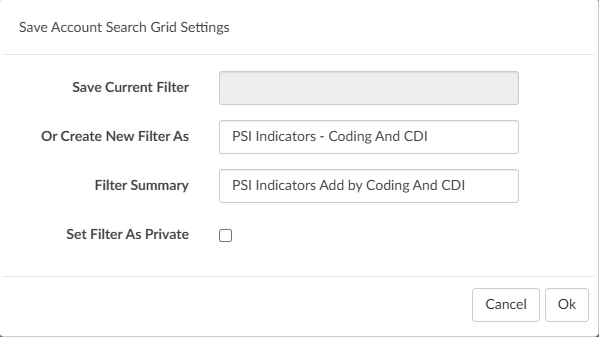
Saving a Search
Account searches can be saved for future use.

When saving a search, a new field will show in the save box called Filter Summary. If filled out, the summary will show in the banner of the search next to the Drill-Down Level.
Scheduling a Report
When a search is saved, a +Add Scheduler button will appear for users in Account Search to open a dialog box to create/edit/delete a schedule. Each saved search can have one schedule.

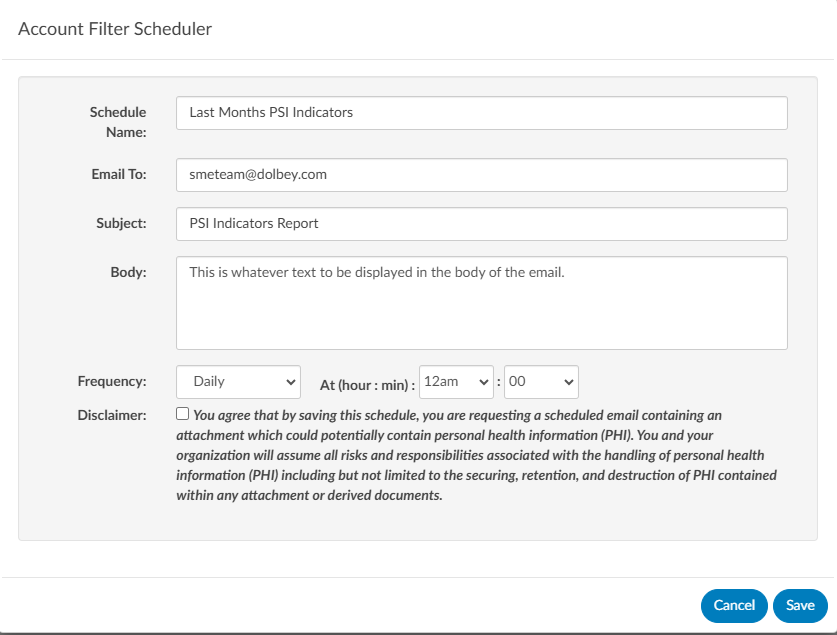
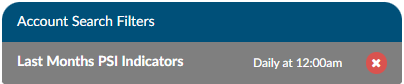
Once the user fills this out and saves, the button changes so the user can edit the scheduled report from account search.

Users can also see the account searches that were scheduled under the reporting tabs and scheduled user reports.
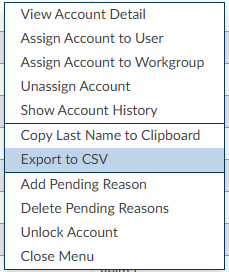
Export to CSV
Search results can be exportd from the right click menu. Exporting in the CSV format allows users to view them in Excel. Exported results will maintain the columns and grouping.
Calendar View
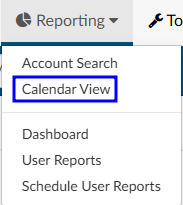
The calendar view will show which users touched charts on a specific day and the actions they took. Upon first logging on, users will be presented with a calendar view. By default, the view shows the current calendar week.
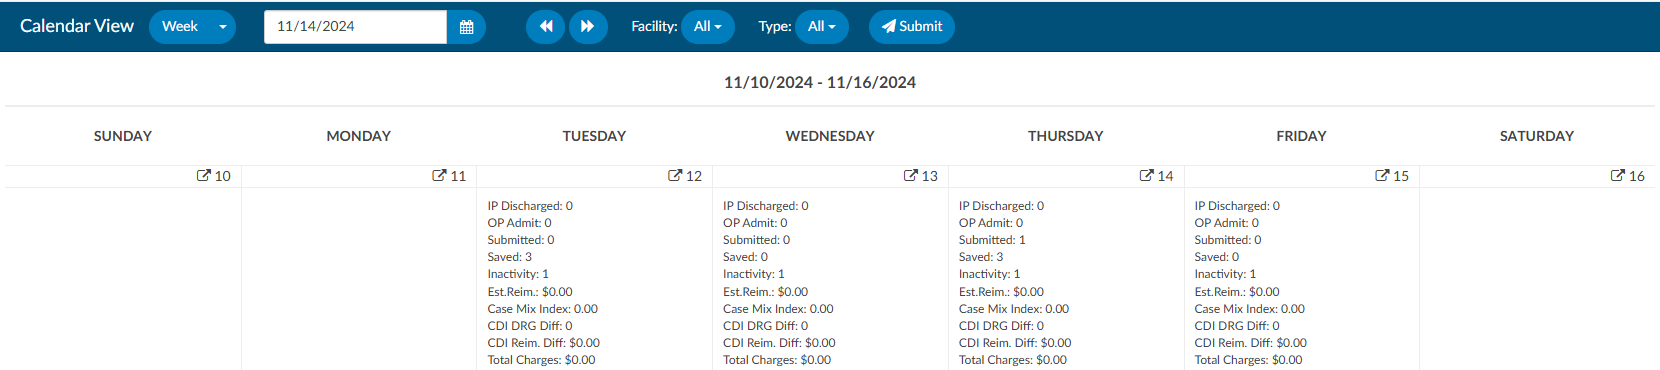
To view the entire calendar month or choose a date range use the control keys at the top of the calendar.

The left and right buttons located at the right of the date field will allow you to change the month forward or backward one month per click. Each of the calendar days have information provided which are defined below. The facility drop down menu, will allow the user to select a facility (if applicable). The type drop down menu, will allow the user to select a patient type (category) (if applicable). Once the parameters havee been defined, click Submit to display the data within the calendar.
Statistics
Each Calendar date has its own overview statistics. The numbers and totals shown on the calendar are distinct numbers, meaning each chart is only considered once per each category below even if a user clicked save or submit multiple times it will be ONLY counted once.
| Statistic | Description |
|---|---|
| IP Discharged | This is a total inpatient chart that received a discharge date of the date you are viewing on the calendar. |
| OP Admit | This is a total outpatient chart that received an admit date of the date you are viewing on the calendar. |
| Submitted | This is the total number of charts that the user clicked the submit button. This is a distinct number of submits which means that each chart even if a user clicked submit multiple times it will be ONLY counted once. |
| Saved | This is the total number of charts that the user clicked the save button. This is a distinct number of submits which means that each chart even if a user clicked save multiple times it will be ONLY counted once. |
| Inactivity | This is an account that was saved automatically due to inactivity (session timeout). |
| Est. Reim. | This is the total number of charts that the user has clicked the submit button that resulted in the encoder sending an estimated reimbursement, commonly this only occurs on inpatient charts when a DRG is calculated. |
| Case Mix Index | This is the total number of charts that the user has clicked the submit button, commonly this only occurs on inpatient charts when a DRG is calculated. |
| CDI DRG Diff | This is the total number of charts that resulted in a difference in DRG from CDI to Coding. |
| CDI Reim Diff | This is the reimbursement difference of charts that resulted in a difference in DRG from CDI to Coding. This number will not populate if you do not have the reimbursement coming back from the encoder with the DRG. |
| Total Charges | This is the total charges from the charts that the submit button was clicked on. |
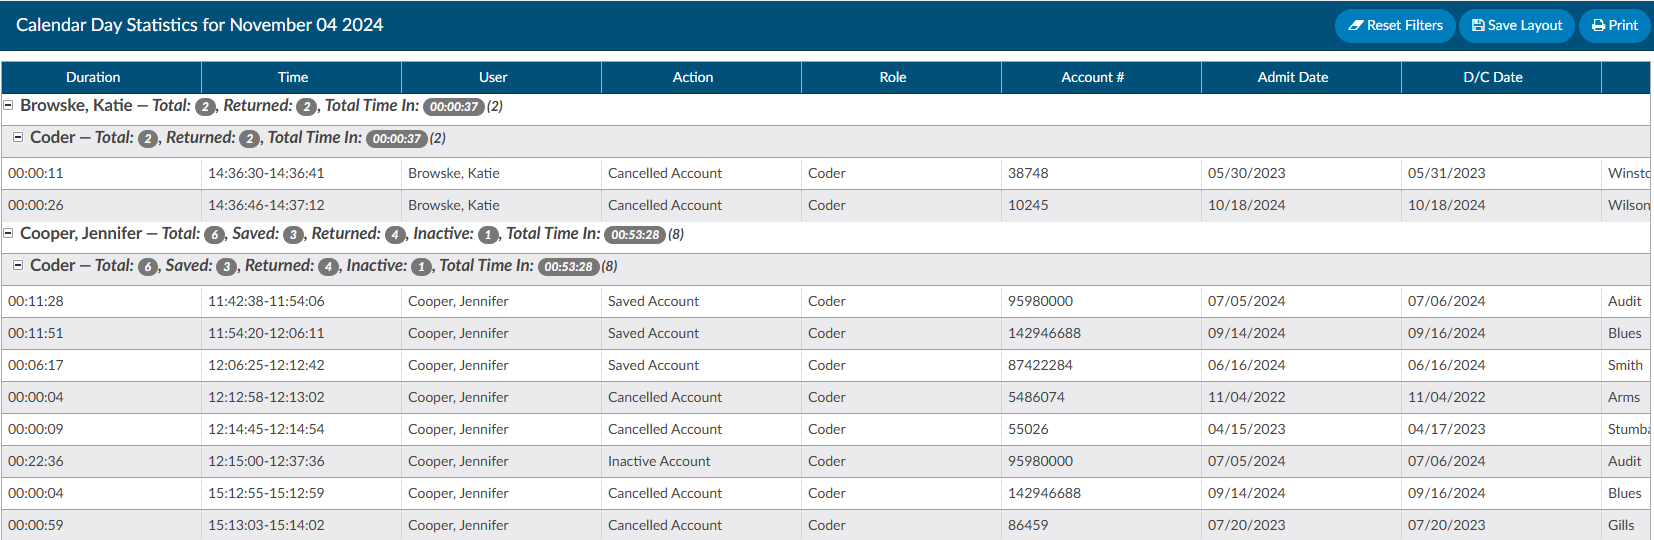
To review the details surrounding a calendar date, click on the square with an arrow next to the calendar date. This will display the calendar day statistics making up the overview data.

Calendar Day Statistics
All counts on the grouping row of the Calendar Stats by Day page are based on distinct accounts. Categories will be hidden if they have a count of zero. The information grid below the total sum will be an audit trail and will not add up to the grouping counts.
| Field | Description |
|---|---|
| Submitted | Submitted is a term used to mean the chart was completed by coding. This also means that the code packet including patient demographics, code data, and abstraction fields have been passed to the abstraction system to be finalized. |
| Resubmitted | Resubmitted is a term used to mean the chart was completed by coding and the chart had already had a submit action performed. This also means that the code packet including patient demographics, code data, and abstraction fields have been passed to the abstraction system to be finalized. |
| Saved Account | Saved is a term used to mean the chart was not completed by coding. A user may save a chart if there was missing documents, query or the user could not complete the chart at the time of coding. |
| Inactivity | Inactivity is a term used to mean the chart was saved automatically due to inactivity (session timeout). |
| Canceled Account | Canceled is a term used to mean the chart was opened, nothing was changed on the account, and it was returned to the queue to be coded by another user. |
View Account Codes
To view an account, right click on any of the grid rows. This will display codes assigned to this account.
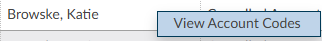
This view provides a look at codes that were assigned by Coders and/or CDI. Not all charts will have both user views. Available views will depend on if the chart opened yields information from one or both user types. This view will indicate the state of chart for the audit item selected.
The columns listed below are default, however a user can change this display by hovering over a grid field and selecting the 3 horizontal lines.
| Column Name | Description |
|---|---|
| Duration | This field provides the total time that a user entered into the account displayed to the right of this field this will display in HH:MM:SS. |
| Time | This field provides the time that a user entered into the account displayed to the right of this field. |
| User | This is the person who performed the action. |
| Account # | This is the account # of the patient chart the user reviewed. |
| Action | This is the action the user did. An action being submit, resubmit, cancel or save. |
| MRN | This is the MRN of the patient chart the user reviewed. |
| Patient Name | This is the patient name of the patient chart the user reviewed. |
| Status | Submitted – The chart has been sent outbound to a downsteam system (abstraction or billing) Unbilled – The chart has not yet been submitted yet. QA - The system had workflow that placed this chart into QA, there are many reasons please consult your workflow manual. |
| Admit Date | This is the admit date of the patient chart. |
| Discharge Date | This is the discharge date of the patient chart. |
| LOS | This is the LOS the CAC system calculated based on the admit and discharge date of the patient chart. |
| Category | This is the patient type of the patient chart. |
| Facility | This is the facility of the patient chart. |
User Reports
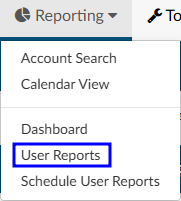
User reports are canned reports that are preformatted. User reports were created to be run on-demand, but many reports can also be scheduled to run at a specific date/time interval. Each report is outlined below along with a brief description.
Users looking for data that is not available in user reports can use account search to create custom searches and then export the raw data.
Running a User Report
- Select the report from the available list - the selected report will display a short description on the screen
- Filter as needed - each report is unique in the style of data it will yield. Review filter options and use as needed.
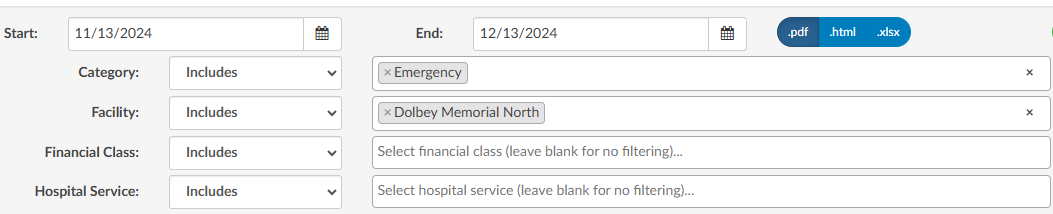
CDI Filters
Most CDI reports contain additional filters to give the user the option to filter as ‘ include’ or ‘exclude’
- Select the format of the report - .xlsx will result in a file in the users downloads folder.

- Select Run Report

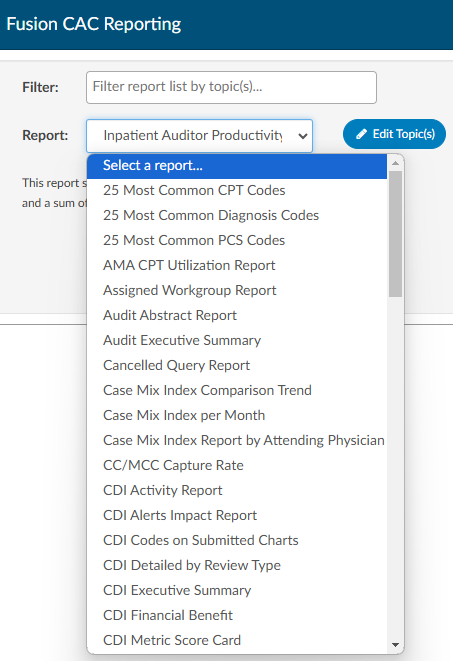
User Reports and Descriptions
The following is a complete list of Fusion CAC’s default reports and their descriptions. An organization may have custom reports that do not appear in this list. Additionally, some reports may be part of an add-on module. For questions or if there are other reports your organization would benefit from and you cannot pull the data you need from account search please contact our SME Team (smeteam@dolbey.com) to discuss options.
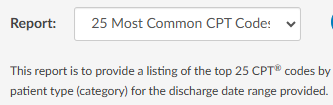
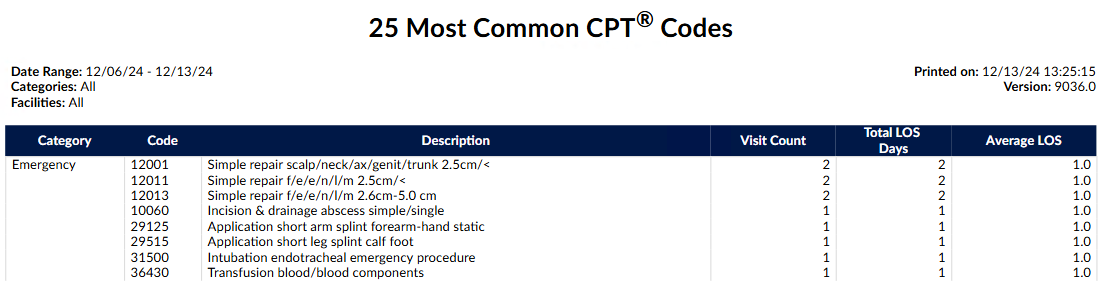
25 Most Common CPT Codes Report
This report is to provide a listing of the top 25 CPT® codes by patient type (category) for the discharge date range provided. The Date Range for this report is the Chart Discharged Date.
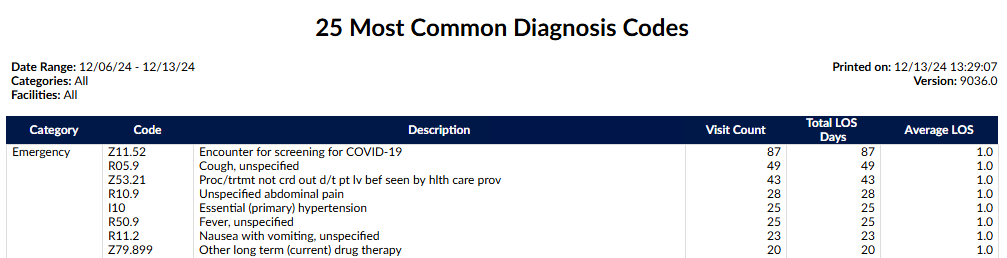
25 Most Common Diagnosis Codes Report
This report is to provide a listing of the top 25 diagnosis codes by patient type (category) per the discharge date range provided. The Date Range for this report is the Chart Discharged Date.
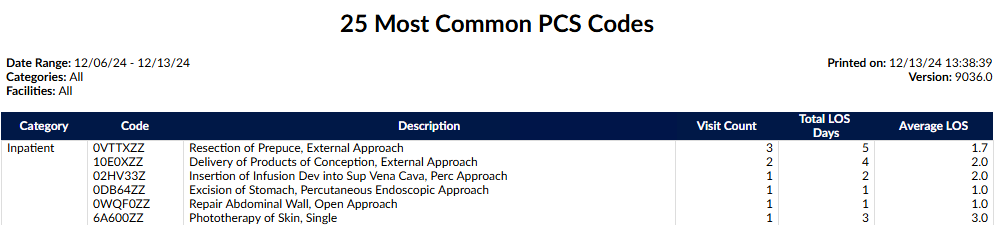
25 Most Common PCS Codes Report
This report is to provide a listing of the top 25 PCS codes by patient type (category) per the discharge date range provided. The Date Range for this report is the Chart Discharged Date.
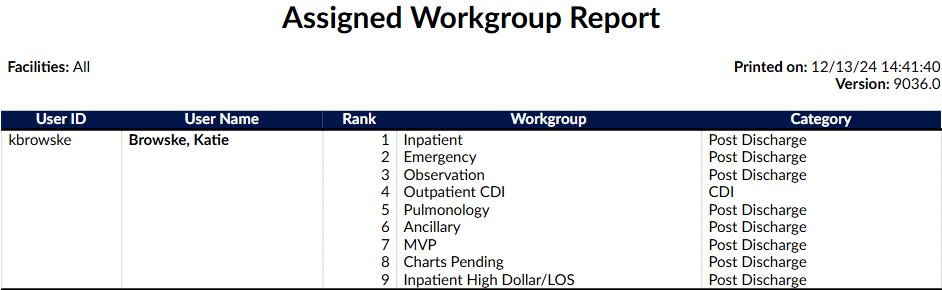
Assigned Workgroup Report
This report provides details about each of the users and what workgroup they are assigned to in sequence. The date range input is irrelevant for this report and will always display the user’s current workgroups.
Date Criteria Ignored
Date criteria are not used for this report. The user’s current workgroup assignments are reported.
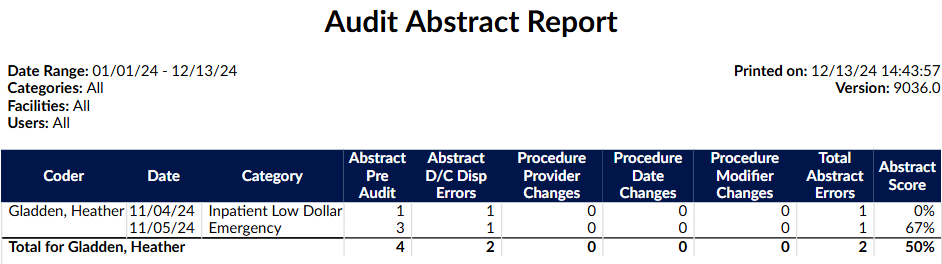
Audit Abstract Report
This report will provide an overview of the abstraction scores for each user based upon a date range.
Notes:
- Abstract Pre-Audit value is the total number of abstraction items (discharge disposition change, date changes and provider changes) added pre-audit.
- Abstract D/C Disp Errors value is the total number of discharge disposition errors.
- Procedure Provider Changes value is the total number of procedure provider changes (PCS and/or CPT).
- Procedure Date Changes value is the total number of procedure date changes (PCS and/or CPT).
- Procedure Modifier Changes value is the total number of procedure modifier changes (CPT).
- Total Abstract Errors value is the Sum of all abstract (discharge disposition change, date changes and provider changes) errors during audit.
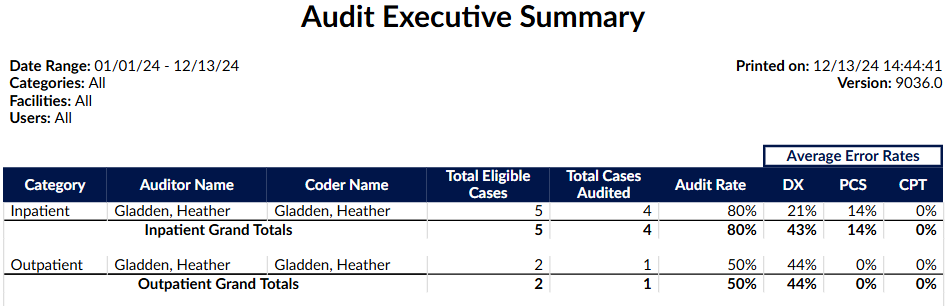
Audit Executive Summary
This report is an executive level view that shows an overview of inpatient and outpatient audit activity by Auditor. It includes the audit rate and average error rates for diagnoses and procedure coding. The date of this report is based on the date the account was first submitted.
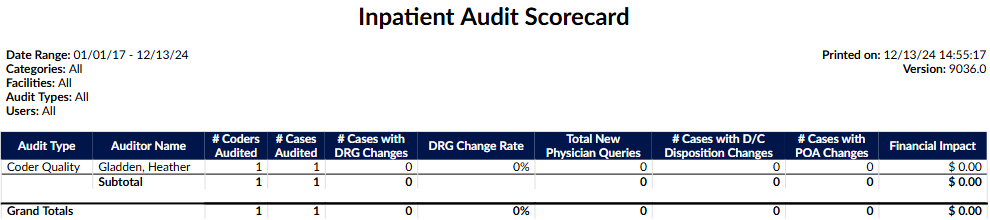
Inpatient Audit Scorecard
This monthly report provides a summary of the Auditor’s work completed for any type of inpatient audit and the financial impact based on the audit findings. This report will show number of coders and coded encounters audited that resulted in a DRG change and either over payments or under payments. This report will also show the details of physician queries that resulted because of the audit and financial impact of changes made.
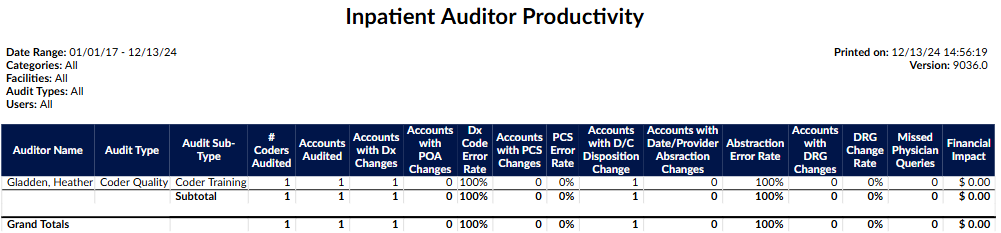
Inpatient Auditor Productivity
This report shows auditor productivity by audit type and sub-type and a sum of the total outcomes for each.
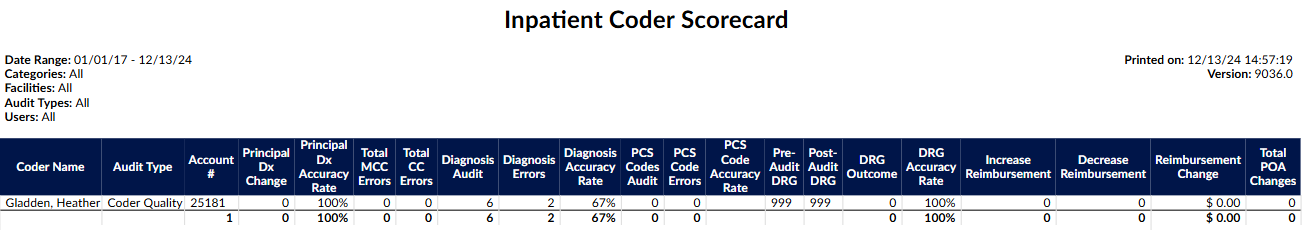
Inpatient Coder Scorecard
This report shows, on an individual coder basis, the principal diagnoses, secondary diagnoses, and procedure code assignment errors that may or may not have resulted in a DRG change and financial impact. The report has an audit present. The date range for this report is for the date the audit was performed.
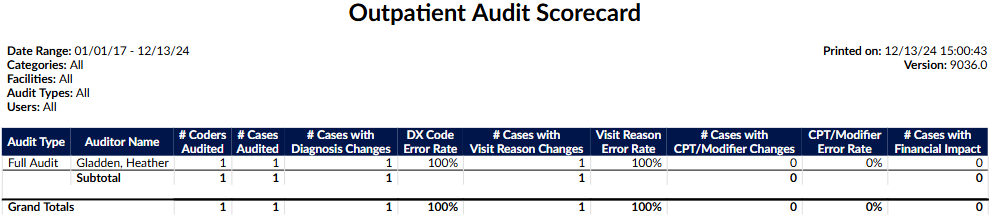
Outpatient Audit Scorecard
This monthly report provides a summary of the Auditor’s work completed for any type of outpatient audit.
Outpatient Auditor Productivity
This report shows auditor productivity by outpatient audit type and sub-type and a sum of the total outcomes for each.
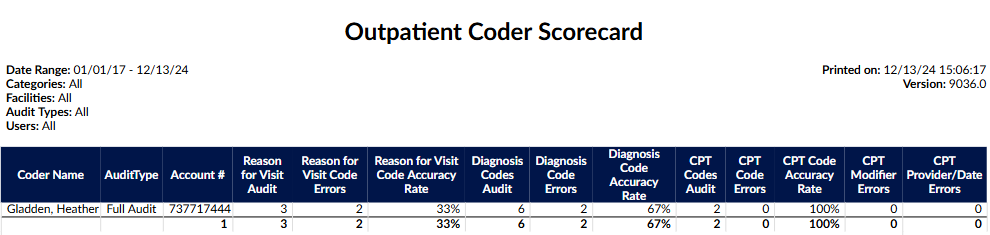
Outpatient Coder Scorecard
This report shows, on an individual coder basis, the errors and accuracy rates for diagnosis codes including Reason for Visit and secondary diagnoses; errors in CPT code assignments, modifiers, charges, and procedure details (provider name and date of procedure). The date range for this report is for the date the audit was performed.
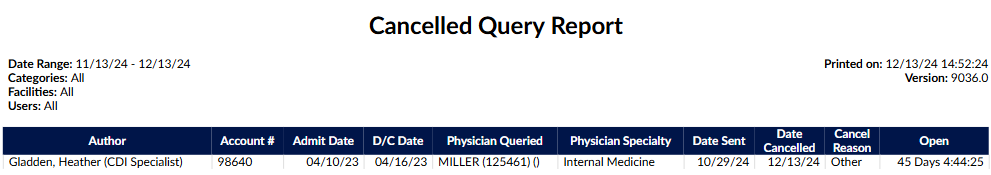
Cancelled Query Report
This report is to track Physician Queries that were cancelled within the date range specified. Only queries cancelled from within the Physician Query viewer will be tracked on this report, i.e. any third- party cancellations will not appear. Created date and cancelled date will be displayed, along with the amount of time the query was open. The date range for this report is the date that the physician query was cancelled.
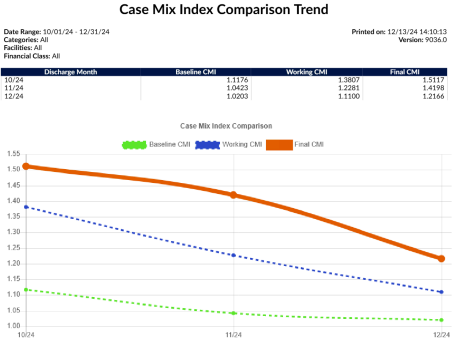
Case Mix Index Comparison Trend Report
This report shows the Baseline, Working, and Final CMI per discharge month. (Filtering: Only run as a monthly report). The date range on this report is the Chart Discharge Date please note the range is expanded to the full month.
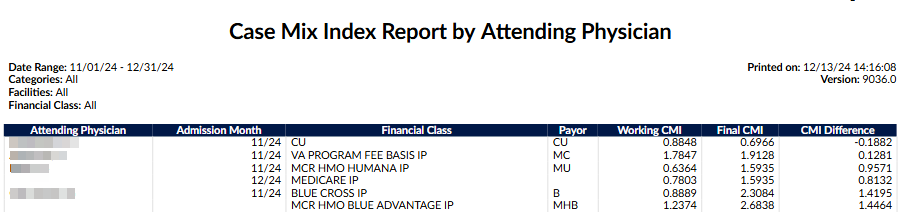
Case Mix Index Report by Attending Physician Report
This report will show the difference between the most Current Working CMI and Final CMI, additionally providing the CMI Difference (Final CMI – Current Working CMI.) This report will show how the physician’s documentation impacted the chart over the course of the patient’s stay. If the physician documented appropriately, the Current Working and Final DRG should be very close. If the DRGs are far apart, the likely cause is that either the CDI did not have the documentation, or the physician did not document the chart comprehensively. This report should be used in conjunction with additional auditing on the attending physician if you are questioning the results. (Filtering: Only run as a monthly report). The date range for this report is on the Chart Admit Date
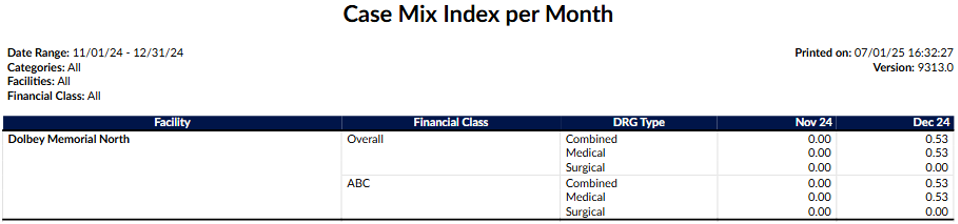
Case Mix Index per Month
Date Range: Chart Discharge Date (only Submitted Inpatient charts with a DRG Weight valued will appear in this report) This report will provide a monthly case mix overall for all financial classes then for each financial class. This report is based upon final coded outcomes. A “case mix index” is the average DRG Weight of accounts that have a DRG Weight - This report only includes submitted inpatient accounts with a DRG Weight.
Total Groups
Totals are displayed differently based on the facility filter and the number of facilities returned by the report.
- If there is no filter on facility and more than one facility is in the report, an additional “All Facilities” group is appended that calculates the case mix for each financial class across all facilities.
- If there is any filter on facility and more than one facility is included in the report, an additional “Combined Facilities” group is appended that calculates the case mix index for each financial class across the filtered facilities.
- If only one facility appears in the report, there is no “All Facilities” or “Combined Facilities” group.
Blank Field Values
Blank facilities or financial classes are displayed as an empty string to be consistent with other reports.
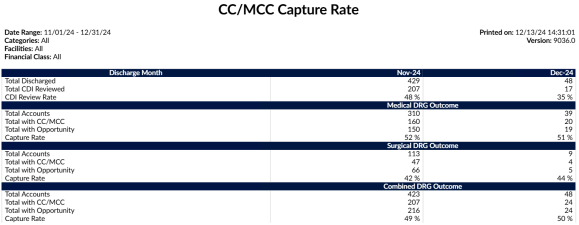
CC/MCC Capture Rate
This report provides the final outcome of CC/MCC capture rate. This can be used to compare the CC/MCC capture rate to those DRG’s that don’t have a DRG but, have the opportunity to be maximized which is defined as DRG’s with a DRG description of without CC/MCC, w/o CC, w/o MCC. This report will tell you what opportunities may have been missed
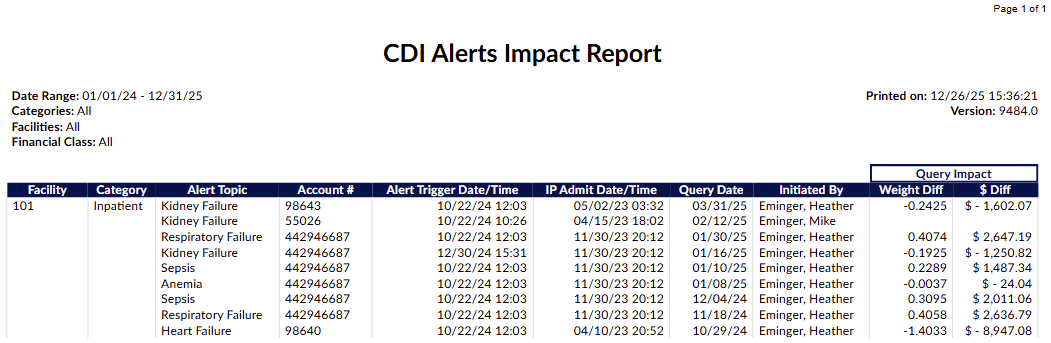
CDI Alerts Impact Report
This report allows the user to see what the overall impact on CDI Alerts. It gives the user insight on how impactful the CDI Alert was. It will allow user to see not only if the Alerts are having an impact, but also how much benefit the Alert was. It also shows us which Alerts may be having little to no impact and may need to be adjusted accordingly.
CDI Alerts Required
CDI Alerts must be implemented to use this report. The date range is based on the admite date of the chart, which must be inpatient and have MatchedCriteriaGroups validated CDI Alerts.
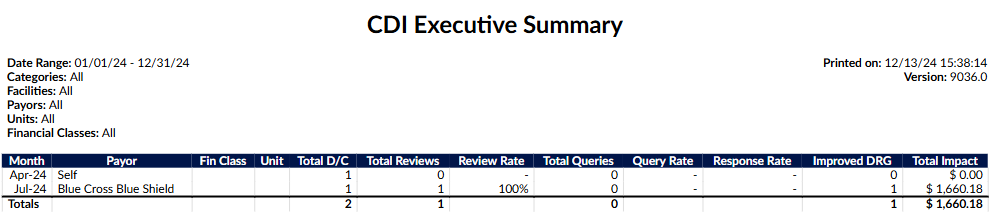
CDI Executive Summary Report
This report is an executive level view broken down per month that shows total discharges vs. total reviews in addition to the # of total queries, response rates and improved DRG’s. The improved DRG is calculated by determining if there was a positive reimbursement gain from the baseline to the working DRG. (Filtering: Max of 12 months selected; only run as a monthly report). The date range on this report is the Chart Admit Date, please note that this report date range is expanded to the full month
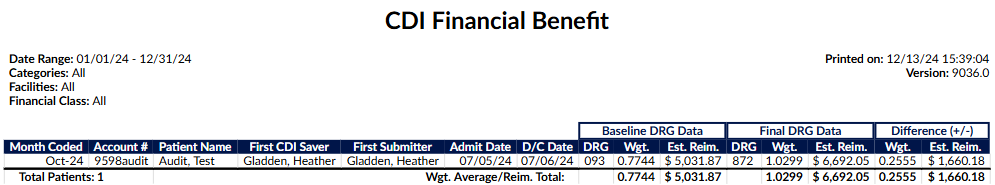
CDI Financial Benefit Report
This report is broken down per month coded and the total financial impact CDI had on the chart. The report will only display charts with unmatched DRG’s and show a financial impact based on the baseline DRG to final coded DRG. The date range on this report is the Chart Submitted Date (LastSubmitter).
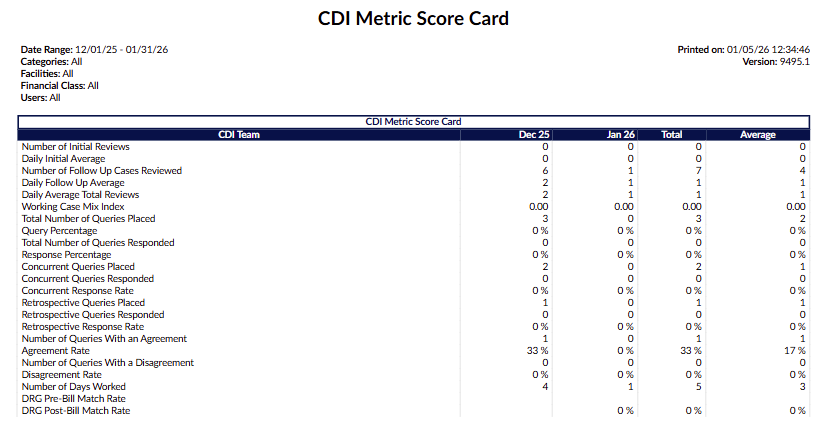
CDI Metric Score Card
This report shows CDI productivity based upon the CDI user reviews and queries. The report will show CDI activity specifically on the number of initial reviews (first time a CDI reviews a chart), number of follow up reviews (reviews beyond the first time a CDI reviews a chart), queries issued, agreed upon query amounts, and the number of days we show activity occurring. The Total column calculates the combined statistics for all months within the report. By comparison, the Average column calculates the average statistics per month within the report.
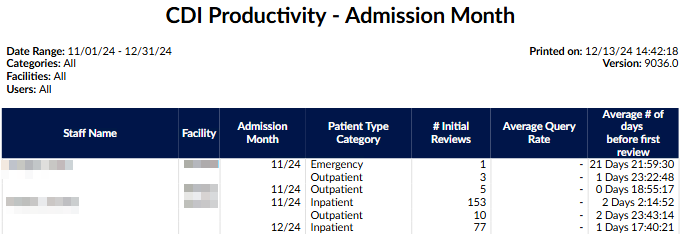
CDI Productivity - Admission Month Report
This report shows CDI productivity based upon the admission month of the patient. The report will show CDI activity specifically on the # of initial reviews (first time a CDI reviews a chart). A review is calculated by the following:
- Inpatient: First time a user with a role of CDI computed a Working DRG and saved the chart.
- Outpatient: First time a user with a role of CDI saved the chart.
This report will also tell you out of the charts the CDI staff member completed what the query rate is and on average how many days did it take before the chart was initially reviewed. Reporting is done on the admission month, so this report displays any patient discharged or not discharged during this admission month if there was a CDI review. (Filtering: Only run as a monthly report). The date range on this report is the Chart Admit Date, please note that this report date range is expanded to the full month.
CDI Query Detail Report
This report provides details of physician queries created by CDI Specialists on accounts that have since been discharged. This report details how the account evolved from a Baseline DRG to a Final DRG.
No PDF Support
Due to the number of columns, this report is not intended to be launched as a PDF.
Any non-canceled physician query created by a CDI Specialist on an inpatient, now-discharged account should appear as a line item on this report.

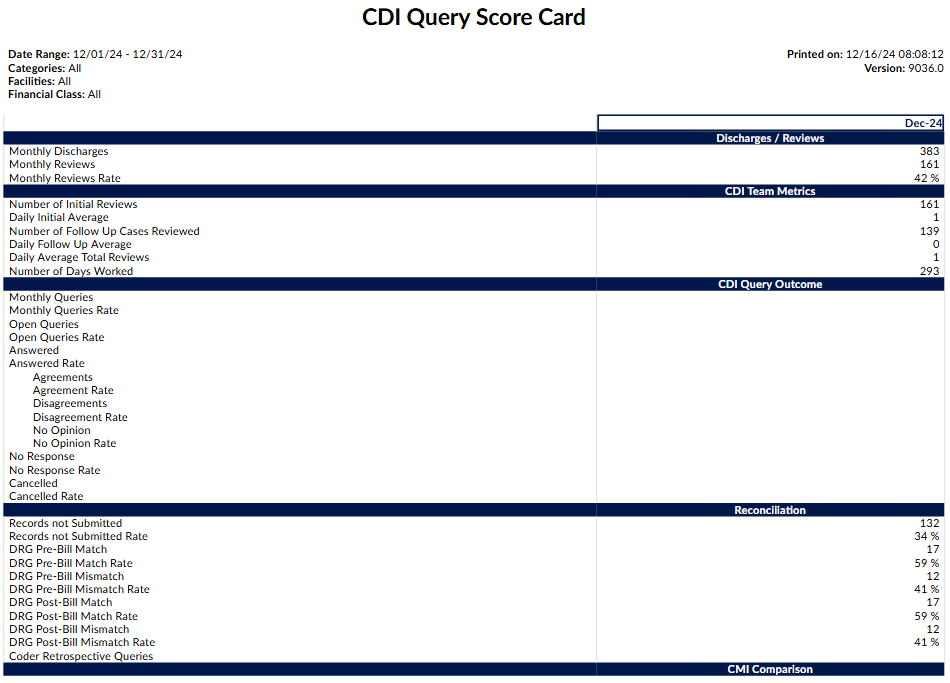
CDI Query Score Card Report
This report is displayed in several sections:
- Discharge/Reviews – This section reports on the review rate of the CDI team. It displays the number of patients discharged in the current month along with how many of them were reviewed by CDI.
- CDI Query Outcome – Of the charts that made up the review rate under discharges, this section displays the total that resulted in queries that are broken down more granularly by the physician’s response rate.
- Reconciliation – This section displays charts that created the review rate section and have a final DRG without having a submitted status. This section shows how often CDI and coders agree on the DRG.
- CMI Comparison – This section reviews where the chart started (Baseline DRG CMI) and where the chart ended up (Final DRG CMI – which is the reported CMI). (Filtering: Max of 12 months selected; only run as a monthly report).
- CDI Team Metrics - The calculations within these sections are like the existing fields in the CDI Metric Score Card report, but the review counts are determined by the discharge date or admit date of accounts, respectively
The date range on this report is the Chart Discharged Date, please note that this report date range is expanded to the full month
CDI Query Score Card by Admission Month
This report is displayed in 4 sections:
- Admit/Reviews – This section reports on the review rate of the CDI team. It displays the number of patients admitted in the current month along with how many of them were reviewed by CDI.
- CDI Query Outcome – Of the charts that made up the review rate under admits, this section displays the total that resulted in queries that are broken down more granularly by the physician’s response rate.
- Reconciliation – This section displays charts that created the review rate section and have a final DRG without having a submitted status. This section shows how often CDI and coders agree on the DRG.
- CMI Comparison – This section reviews where the chart started (Baseline DRG CMI) and where the chart ended up (Final DRG CMI – which is the reported CMI).
(Filtering: Max of 12 months selected; only run as a monthly report).
Calculations
- Daily Initial Average is simple math of two other values to get the average number of initial reviews per day:
- Daily Initial Average = (Number of Initial Reviews) / (Number of Days Worked) - rounded to whole number
- Daily Follow Up Average is similar:
- Daily Follow Up Average = (Number of Followup Reviews) / (Number of Days Worked) - rounded to whole number
- Daily Average Total Reviews is simply adding both averages:
- Daily Average Total Reviews = (Daily Initial Average) + (Daily Follow Up Average) - rounded to whole number
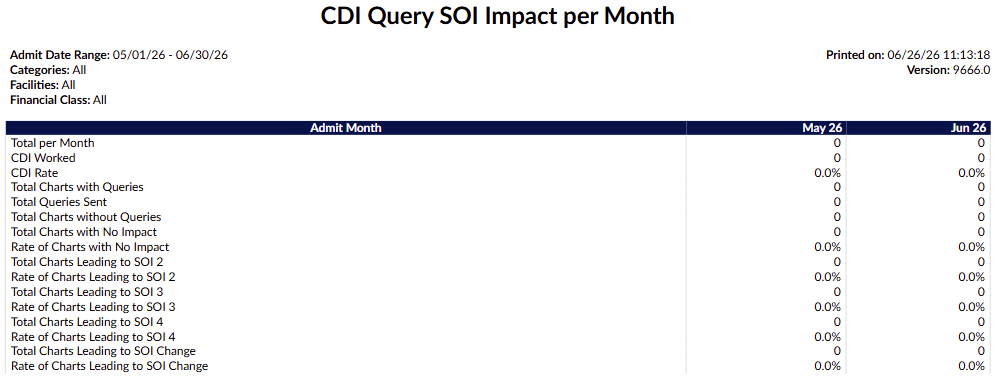
CDI Query SOI Impact per Month
This report provides CDI teams with a monthly view of query activity and the resulting impact on patient SOI for submitted inpatient accounts. It tracks accounts where a CDI Specialist established a Baseline APR-DRG and a Coder’s Final APR-DRG reflected a higher SOI, allowing teams to monitor documentation improvement trends and measure the effectiveness of their query practices. Users can filter results by either Admit Date or Discharge Date, with a maximum range of 12 months. When exported to Excel, the report includes four tabs; a cover sheet, a details tab, a summary, and a bar chart visualization; while PDF and HTML exports display the summary only.
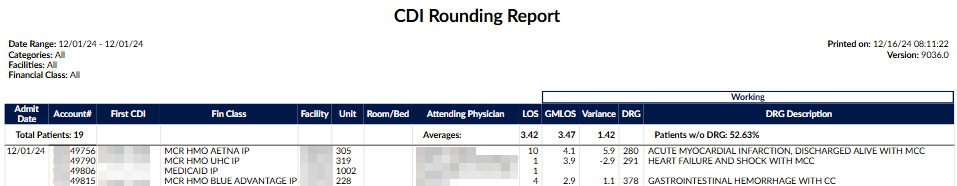
CDI Rounding Report
This report shows all charts reviewed and not reviewed by CDI. If the account has not been reviewed by CDI, working information will be blank to allow CDI to take notes while rounding. If the account has been reviewed by CDI, this report will show an account level view by admit date of the difference between the ALOS and the GMLOS based on the most current Working DRG. The variance is the difference between ALOS and the GMLOS. The higher that number, the chart is identified as needing a re-review for potential DRG change and SOI/ROM. The date range on this report is the Chart Admit Date. To qualify for this report the chart must be an Inpatient Chart.
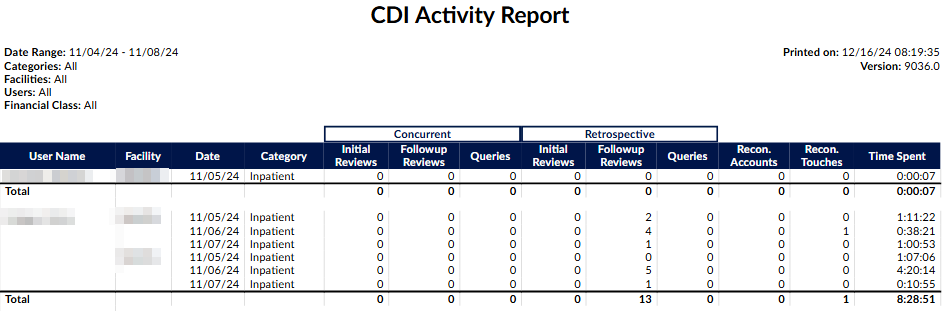
CDI Activity Report
This report shows the number of ‘Initial Reviews’ vs ‘Followup Reviews’ per category (patient type) with the total number of queries sent. (Filtering: Max of 31 days selected). The date range on this report is the Chart Working DRG Save Date/Time (Query Create Date for the Queries.)
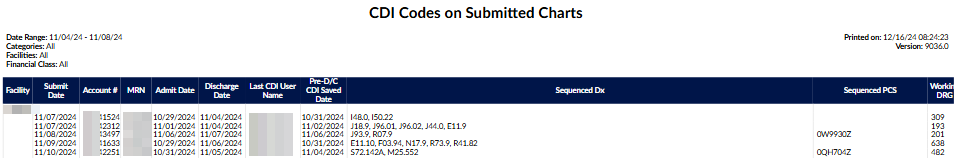
CDI Codes on Submitted Charts Report
This report shows the list of diagnosis codes and procedures that CDI assigned in sequenced order.
No PDF Support
Due to the number of columns, this report is not intended to be launched as a PDF.
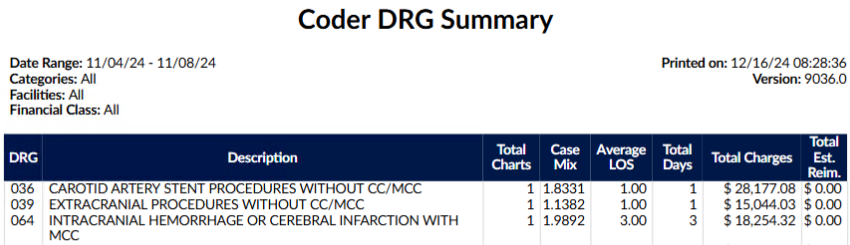
Coder DRG Summary
This report is to show the breakdown per coder MS-DRG to show the total visits per DRG.
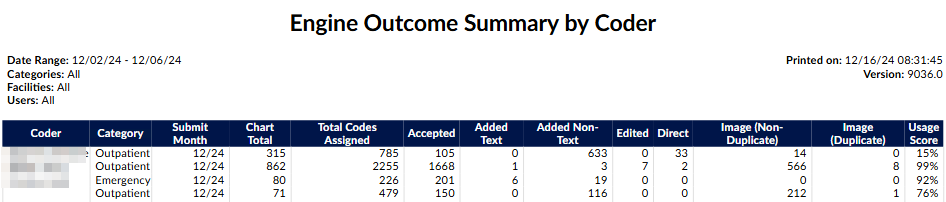
Engine Outcome Summary by Coder Report
This report can be used to determine how the engine performed for the coder. It shows whether they leveraged the code suggestions or if they manually entered codes, bypassing suggestions. Data is gathered based on the date the chart was coded, and is based on final codes, not working. This report should be used in conjunction with a coding audit if needed.
- Accepted: A code suggestion was assigned directly to the account.
- Added: A code was added to a text document manually and assigned to the account.
- Added Text: counts the number of codes added to phrases in text documents that were not suggested by FAE.
- Added Non-Text: counts the number of codes added to the top of text documents and worksheets that were not suggested by FAE.
- Edited: A code suggestion was edited and then assigned to the account.
- Direct: A code was assigned directly to the account manually or from the Solventum CRS encoder, but also suggested by FAE
- Image: A code was assigned from an image document.
- Image (Non-Duplicate): counts the number of codes added to image documents not suggested by FAE.
- Image (Duplicate): counts the number of codes added to image documents that were also suggested by FAE.
The date range on this report is the Chart Submitted Date (FirstSubmitter.)
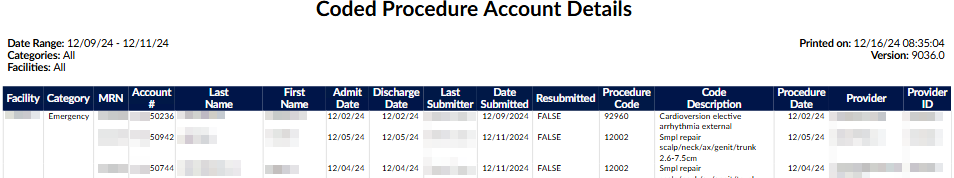
Coded Procedure Account Details Report
This report provides details about charts with assigned procedures. The date range on this report is the Chart Last Submitted Date. To qualify for this report the chart must have at least one Procedure code assigned on the chart.
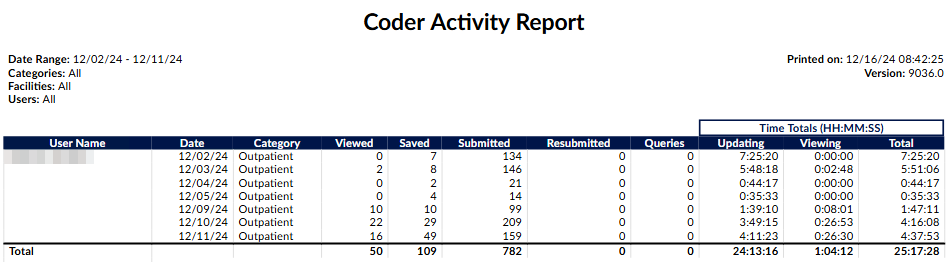
Coder Activity Report
This report shows the distinct number of accounts that were ‘Viewed’, ‘Saved’, ‘Submitted’, and ‘Resubmitted’, then the total number of Queries created, the total time updating, time viewing accounts, and total time spent per day - grouped by coder then by category (patient type) over the date range. Date Range is the date of the activity, beginning of start date to the ending of end date. (Filtering: max of 31 days selected). The date range on this report is the Change History Audit Date (Viewed, Saved, Submitted, Resubmitted actions.
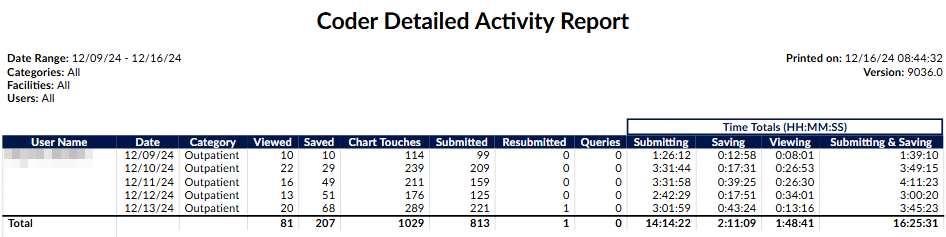
Coder Detailed Activity Report
This report is very similar to the “Coder Activity Report” but with two notable changes:
- The new column “Chart Touches” counts the number of times the user touched" an account on a specific date. A touch is defined as a unique save or submit action.
- The times submitting and times saving are split. If the user loads an accounts, saves it, keeps the account loaded, and then submits it, the time between loading the account and saving it counts as time submitted instead of time saving.
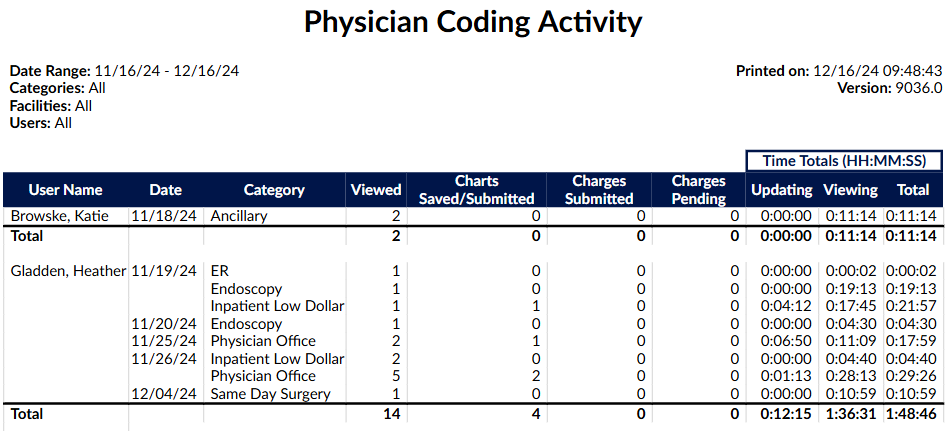
Physician Coding Activity
This report shows the distinct unique charts a physician coder viewed and how many changes were submitted and pended, then the total number of Queries created, the total time updating, time viewing accounts, and total time spent per day - grouped by coder then by category over the date range. Date Range is the date of the activity, beginning of start date to the ending of end date.
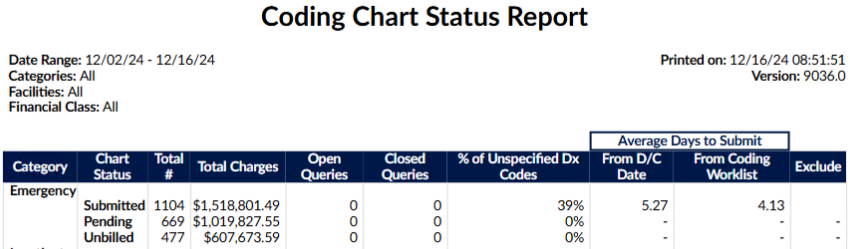
Coding Chart Status Report
This report displays coding productivity in regard to submitted, pending, and unbilled charts. This report shows how long the chart took to code from the time the patient was discharged and how long the chart took from the time the coder had accessibility to the patient chart. Once a patient is discharged, it may be examined for completeness and non-coding staff may place pending reasons on the chart to indicate deficiencies. When the deficiencies are resolved, the chart is then assigned to a coding worklist to indicate the chart is ready for coding. The date range on this report is the Chart Discharged Date
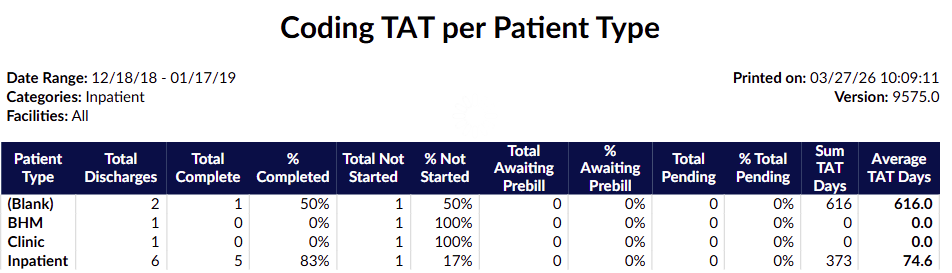
Coding TAT per Patient Type
This report displays coding productivity in regard to submitted, pending, and unbilled charts. This report shows how long the chart took to code from the time the patient was discharged and how long the chart took from the time the coder had accessibility to the patient chart. Once a patient is discharged, it may be examined for completeness and non-coding staff may place pending reasons on the chart to indicate deficiencies. When the deficiencies are resolved, the chart is then assigned to a coding worklist to indicate the chart is ready for coding.
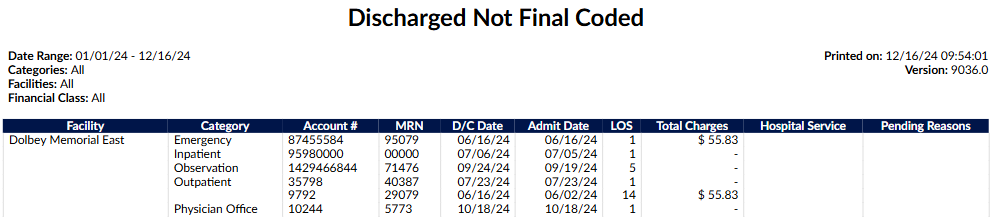
Discharged Not Final Coded Report
This report will show management all of the discharged charts within the system that do not have final coding. The date range for this report is the Chart Discharged Date. To qualify for this report the chart must have a status of Unbilled. If there are multiple pending reasons on a qualifying chart, they will be separated by a comma.
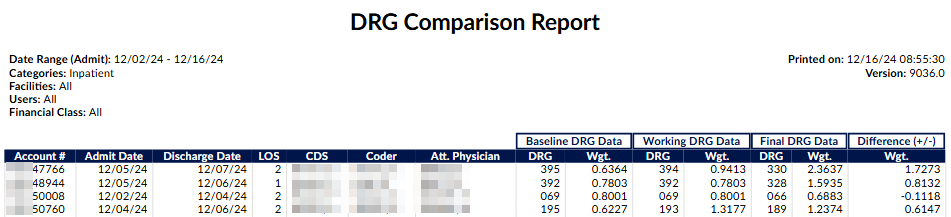
DRG Comparison Report
This report shows the difference between Baseline DRG and Final DRG per account. Only accounts that have both a CDS calculated Baseline DRG and a Coder Submitted Final DRG with an Admit Date within the selected range will be included. The user(s) selected below will constrain the data to either (or both) by the CDS on the most current calculated Baseline DRG or the Coder that last submitted with a Final DRG. (Filtering: Minimum of 1 category selected). The date range on this report is the Chart Admit Date.
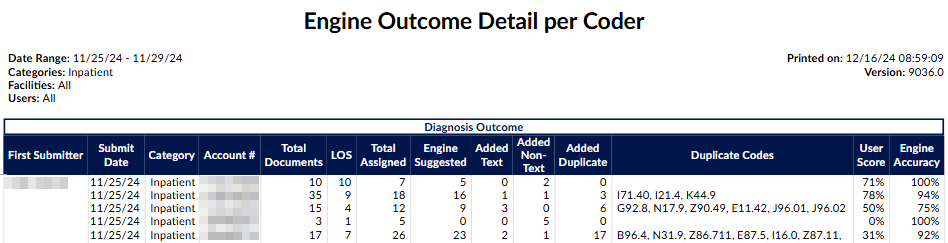
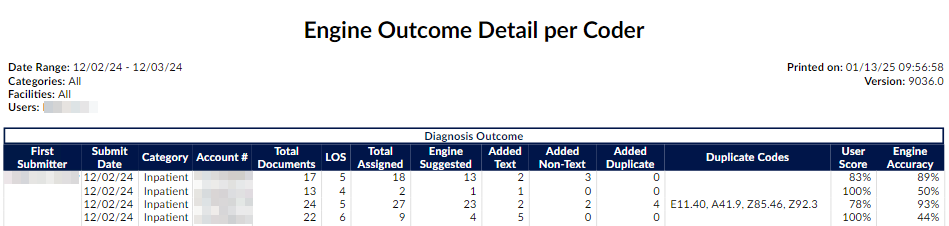
Engine Outcome Detail per Coder
This report should be used to show if the user is using code suggestions or manually adding codes. It will show total assigned codes broken down by code set along with how many codes were suggested by the engine versus added by text documents and non-text documents in addition to those that were added in duplicate. This report card should be used as an educational opportunity to show possible improvements for the end-user and/or code suggestions. This report is recommended to be used in conjunction with an audit.
Documents without codes not included in total
The field “Total Documents” had to be constrained to count the total documents on the account with at least one attached code to make the formulas correct. Documents with no codes (suggested nor added) are not counted in this report (and shouldn’t be since this report is about engine outcome).
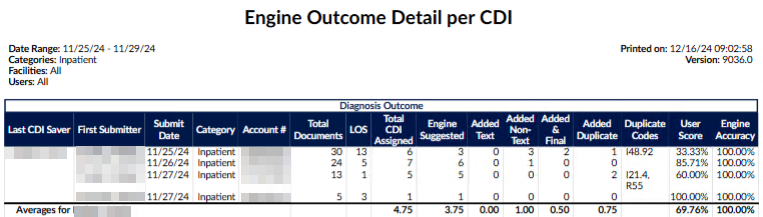
Engine Outcome Detail per CDI
This report shows the total codes that the engine is suggesting, and what CDI is using vs. what CDI is manually adding compared to the coder’s Final Codes. This report should tell the level of manual effort per CDI of those codes that are being used for final code assignment by coders. It will show total assigned codes by CDI broken down by code set along with how many codes were suggested by the engine versus added by text documents and non-text documents in addition to those that were added in duplicate. There is also a column to indicate of the codes manually added how many did the coder assign for final code assignment. This report card should be used as an educational opportunity to show possible improvements for the end-user and/or the code suggestions. This report is recommended to be used in conjunction with an audit.
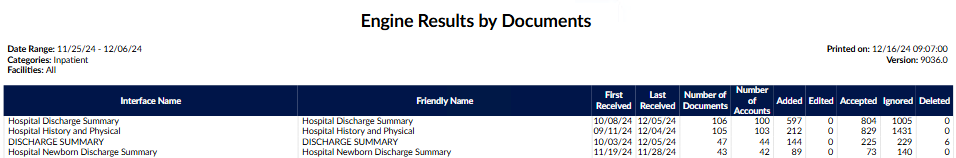
Engine Results by Documents Report
This report shows the default engine accuracy per document at the time of submission. Also, shows the first and last times the document was received on the submitted accounts. The report is sorted from most to least added/edited codes by the coder. The date range on this report is the Chart Submitted Date (FirstSubmitter).
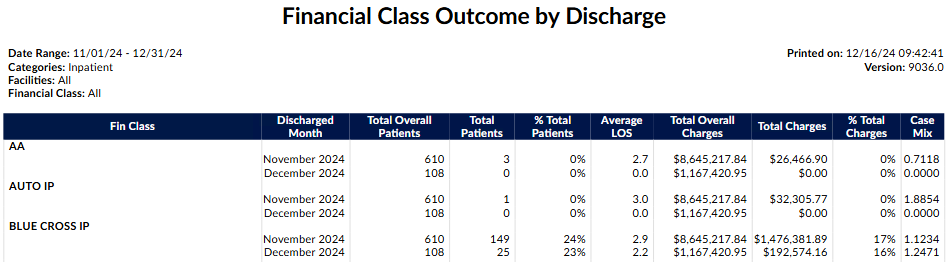
Financial Class Outcome by Discharge Report
This report shows the breakdown per financial class per month. It will breakdown the total patient charts, average length of stay total charts and case mix index.
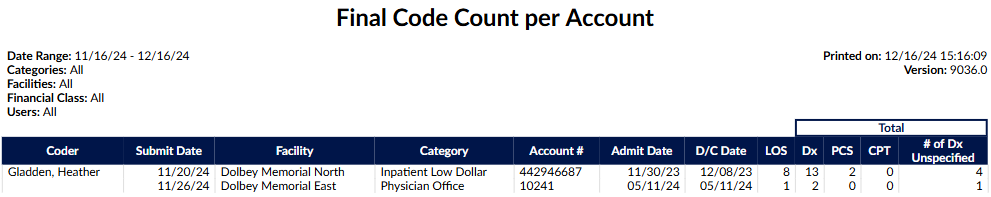
Final Code Count per Account Report
This report shows the submitted chart high level outcomes for diagnosis and procedure codes per account. The Total Dx column displays the total of unique diagnosis codes on the account (visit, admit, principal and secondary); the # of DX Unspecified column shows how many of those codes are showing an ‘unspecified’ designation in their description. This report will allow managers to target coder audits to determine if the chart is being coded correctly or if additional data should have been requested through a query. This report would be used in conjunction with an audit. The date range on this report is the Chart Last Submitted Date (Must have a status of Submitted.)
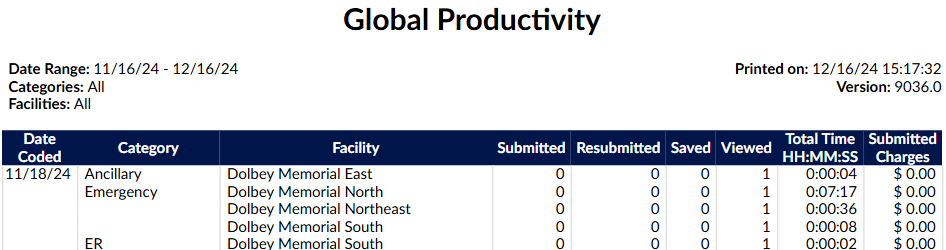
Global Productivity Report
This report shows coder productivity by patient type per day, the number of ‘Viewed’, ‘Saved’, and ‘Submitted’ actions, and the total time logged working on that patient type. (Filtering: Max of 31 days selected). The date range on this report is the Change History Audit Date (Submitted, Resubmitted, Saved, Viewed actions.)
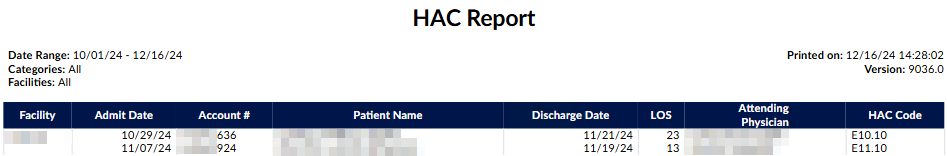
HAC Report
This report is to provide a listing of all patients admitted within the date range of this report that contains hospital acquired conditions. This report only looks at final coded data and does not reflect working data. The date range on this report is the Chart Admit Date.
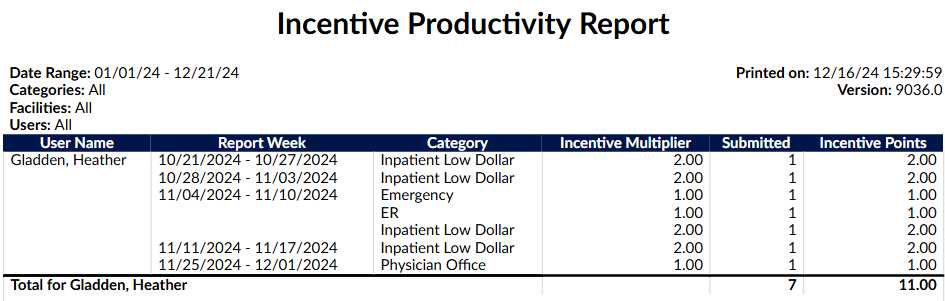
Incentive Productiviy Report
This report applies an incentive multiplier to the distinct number of accounts that were first submitted each week, per user, to calculate incentive points.
- Multiplies the number of first submitted accounts per week by an incentive multiplier per category that is configured in Mappings Configuration.
- The administrator can optionally record an incentive multiplier that is used in this report.
- Categories without a value in the incentive multiplier will be calculated with an incentive multiplier of 1.0.
- This report is like the “Weekly Coder Productivity Report” in that it reports on whole weeks, but only produces an entry if the coder first submitted an account that week.
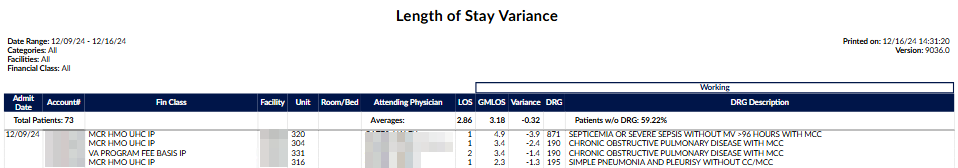
Length of Stay Variance Report
This report shows an account level view by admit date of the difference between the ALOS and the GMLOS based on the most current Working DRG. The variance is the difference between ALOS and the GMLOS. The higher that number, the chart is identified as needing a re-review for potential DRG change and SOI/ROM. The date range on this report is the Chart Admit Date (Must be an Inpatient Chart).
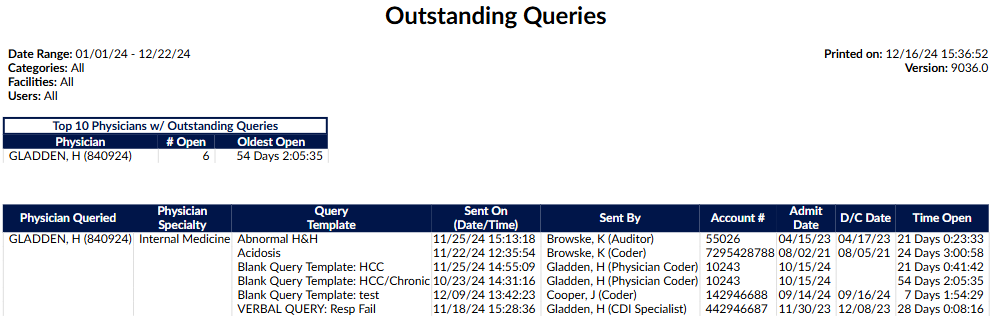
Outstanding Queries Report
This report displays a list of the physicians that have open queries. At the top of the report there is a summary that shows the Top Physicians with outstanding queries and the length of time their oldest query has been open. Date Range: Query Create Date (The date that the query was initially created and sent).
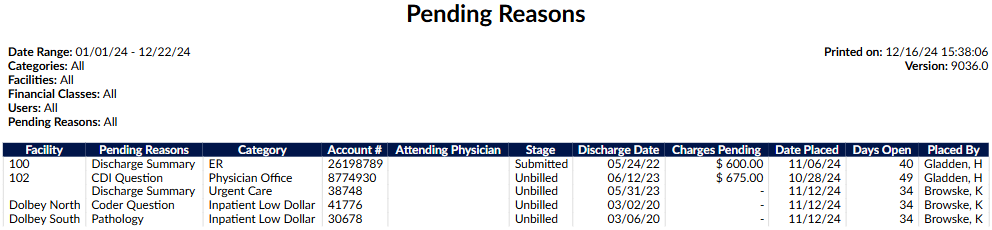
Pending Reasons Report
This report shows which charts are pending, who placed the pending reason, what the pending reason is, and which physician was assigned to the pending reason. Not all pending reasons will have a physician assigned as some pending reasons are not a result of chart deficiency. The date range on this report is the Chart Admit Date.
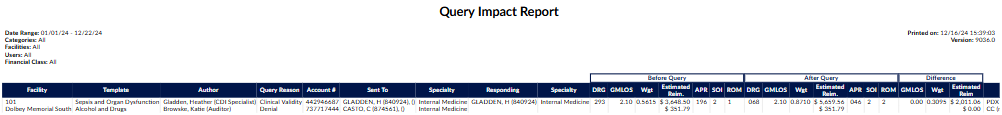
Query Impact Report
This report includes all charts that received queries and resulted in at least one of the following:
- A change in DRG
- Change in CC/MCC/HAC Totals
- Other reasons your facility has defined as a query shift reason
This report will show you the impact that the query made. The report is grouped by query template name, then by Author, then by account #. The query will also show if there was a shift in DRG and what the user listed as the reason for the shift. The date range on this report is the Query Create Date (The date that the query was initially created and sent)
Queries with same DRG & No Shift Reasons Not Included
By design, the Query Impact Report only reports queries that had an impact by either having different before-and-after DRGs or by having shift reasons. The queries not displayed in the Query Impact Report had identical DRGs and no shift reasons, so they were excluded. Hence, the name of the report – Query Impact Report.
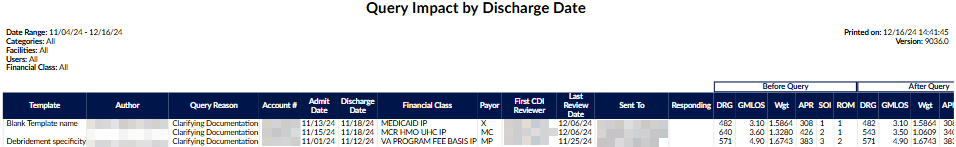
Query Impact by Discharge Date Report
This report includes all charts that received queries and resulted in at least one of the following:
- A change in DRG
- Change in CC/MCC/HAC Totals
- Other reasons your facility has defined as a query shift reason
This report will show you the impact that the query made. The report is based on the patient’s discharge date and is grouped by query template name, then by Author, then by account #. The query will also show if there was a shift in DRG and what the user listed as the reason for the shift. The date range on this report is the Chart Discharged Date.
Queries With the Same DRG & No Shift Reasons Not Included
By design, the Query Impact Report only reports queries that had an impact by either having different before-and-after DRGs or by having shift reasons. The queries not displayed in the Query Impact Report had identical DRGs and no shift reasons, so they were excluded. Hence, the name of the report – Query Impact Report.
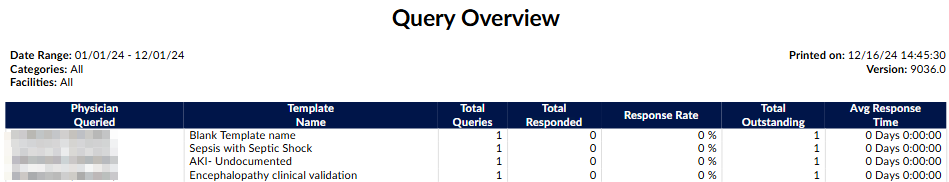
Query Overview Report
This report shows pre-discharge physicians query response or non-response and the template used. The date range on this report is the Query Create Date (The date that the query was initially created and sent).
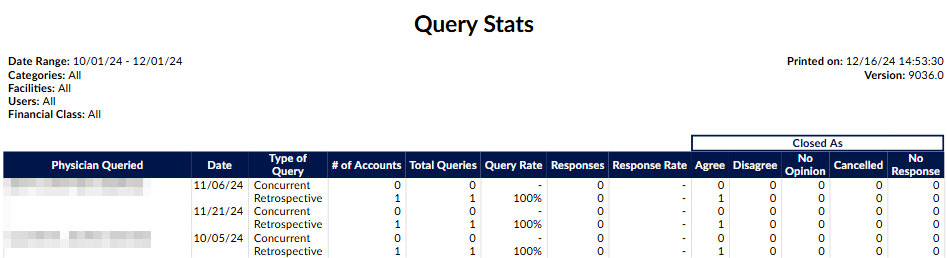
Query Stats Report
This report shows the physicians within the date range that were queried. The report will show how many charts the physician was queried for and how many queries these charts resulted in. The date range on this report is the Query Create Date (The date that the query was initially created and sent.)
Present on Admission Tracking Report
This report is based on the date the patient chart was discharged and its final diagnosis codes. POA Values will be listed, along with HAC determinations if they are present. The totals for the columns Visit Count, Total LOS Days and Average LOS, (if available; Deaths, Autopsy Required) are figured per account, the Totals for the Present on Admit and HAC columns are figured per code. The date range on this report is the Chart Discharged Date.
![]()
![]()
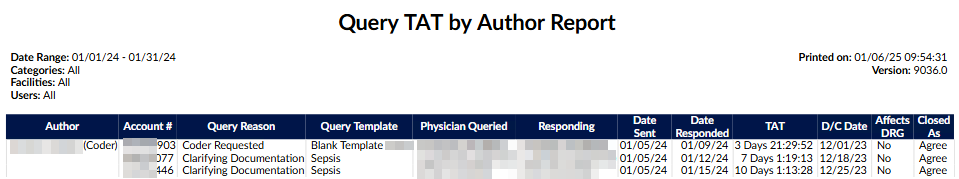
Query TAT by Author Report
This report shows all of the queries that have been responded, with who sent the queries and the turn around time, which is based on the date/time it was sent to the physician until the date/time that the query was responded. The date range on this report is the Query Create Date (The date that the query was initially created and sent).
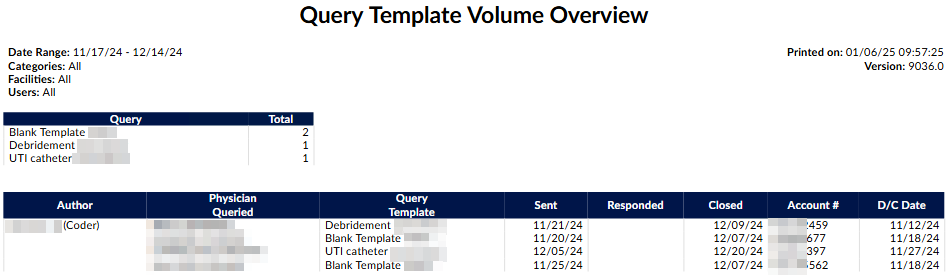
Query Template Volume Overview Report
This report shows the volume of queries per template sorted by whom the query was sent with the date sent and then responded to then when it was closed as agreed, disagreed or no opinion per account along with the discharge date. The date range on this report is the Query Create Date (The date that the query was initially created and sent).
Query Template Volume by Discharge Date Report
This report shows the volume of queries per template for discharged accounts, sorted by whom the query was sent with the date sent and then responded to then when it was closed as agreed, disagreed or no opinion.
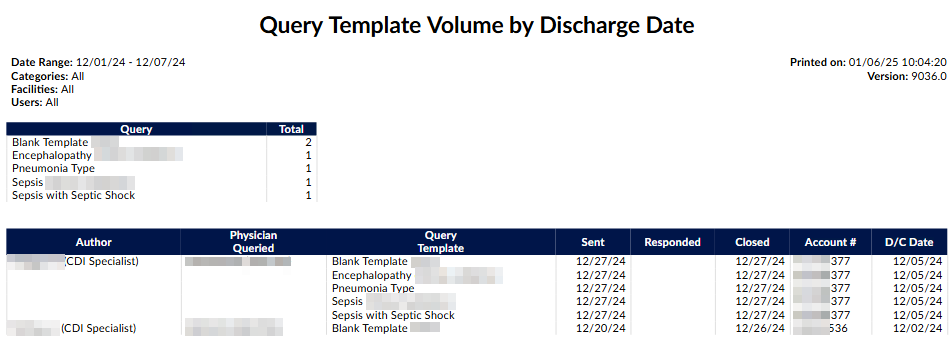
Info
This report is a clone of the “Query Template Volume Overview” report but the date range of the report is by Discharge Date instead of Query Creation Date. This means that only queries of discharged accounts will appear in this report.
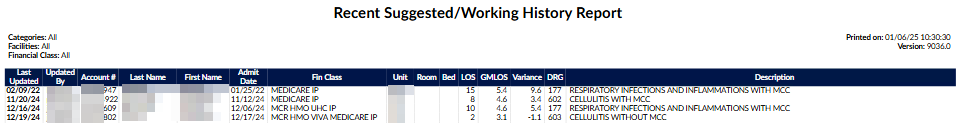
Recent Suggested/Working DRG Report
This report shows all unsubmitted inpatient accounts without a discharge date that have a calculated Suggested or Working DRG, grouped by calculation date. Only the most recent Suggested or Working DRG is displayed for each account. The ““Updated By”” column will say ““Suggested”” to indicate that the DRG was calculated automatically from the Suggested DRG module. Sites that do not use the Suggested DRG module can still use this report to get the most recent Working DRGs for all Inhouse accounts. In addition to displaying the GMLOS, it also displays the LOS and Variance.
The date range is irrelevant and will report on all inpatient accounts with no discharge date that have either a suggested DRG (calculated by the Suggested DRG module) or a working DRG (calculated by a CDI Specialist).
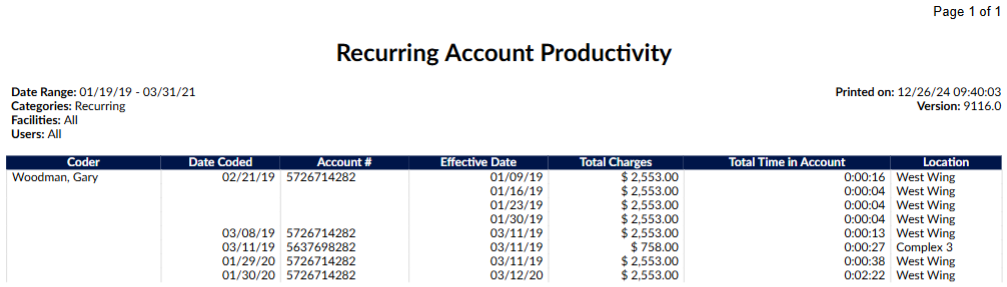
Recurring Account Productivity Report
This report tracks daily productivity for recurring accounts. It uses the effective date to track which occurrence of the account was coded. An account can repeat on the report if the chart has been coded multiple times on the same day with different effective dates. Total time in account is shown as HH:MM:SS. The date range on this report is the Change History Audit Date (Submitted, Resubmitted, Saved, Viewed actions
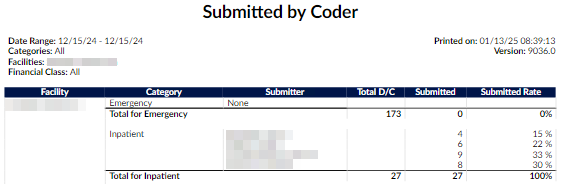
Submitted by Coder Report
This report shows the number of accounts submitted - grouped by facility, category, and submitter - over the account discharged date range. The number of accounts submitted per coder is compared to the total number of accounts per facility and category to calculate a submitted rate. Total discharges are only displayed per facility and category. The date range on this report is the Chart Discharged Date
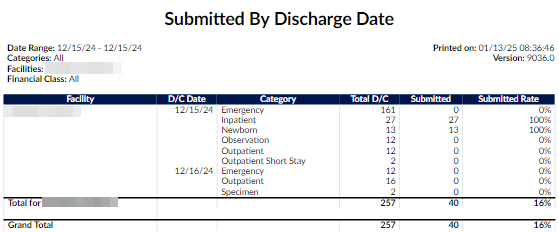
Submitted by Discharge Date Report
This report shows the number of accounts discharged, submitted, and percent of submitted - grouped by facility, discharge date, and patient type over the date range. The date range on this report is the Chart Discharged Date.
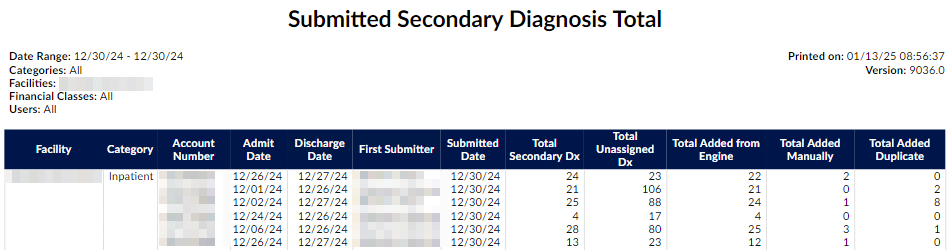
Submitted Secondary Diagnosis Total
This report is based on the first submit of an account. It shows the total number of secondary diagnoses codes per account and whether the end user manually added the code(s), the system suggested them, or the user added AND the engine suggested the code(s). In addition, the total codes still unassigned upon submit will be shown.
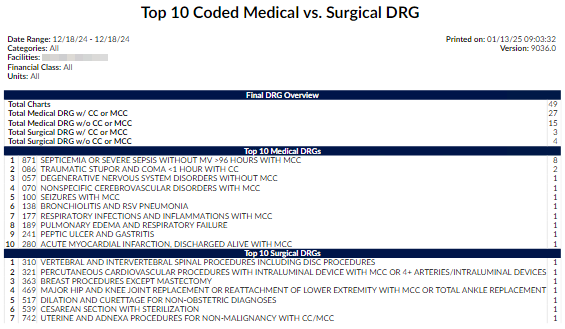
Top 10 Coded Medical vs. Surgical DRG Report
This report displays the Top 10 Medical vs. Surgical DRGs for submitted accounts within the defined discharge date. Medical DRGs and Surgical DRGs are defined by the DRG type that is returned from the TruCode or Solventum CRS encoder. The date range on this report is the Chart Discharged Date (Must be Submitted and have a Final DRG).
User Audit Trail Report
This report shows user activities within the selected date range. Not selecting a User will result in only system events being displayed. (Filtering: Max of 1 user selected; max of 1 day selected). The date range on this report is the Date & Time of the action of the activity.
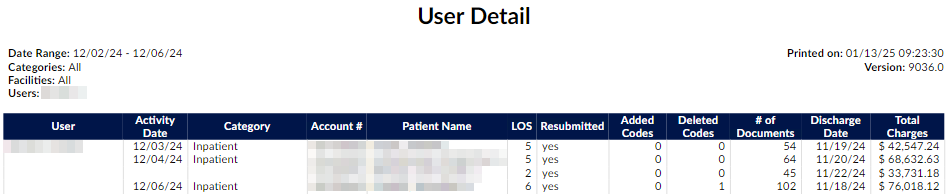
User Detail Report
This report shows the detail of the accounts that are coded including re-submits, the codes Added/Deleted by the coder, number of documents, and Total Charges amounts — grouped by coder over the date range. (distinct accounts) Date Range is the date the account was submitted, beginning of start date to the ending of end date. (Filtering: Minimum of 1 user selected; max of 7 days selected). The date range on this report is the ChangeHistory Audit Date (Submitted actions).
User Login Report
This report shows the login/logout activity of the user. If an inactivity reason was recorded by the user, then the prior logout will be listed as ‘inactivity’ instead of logout and the inactivity reason will be recorded in its own column. Date range available is 31 days, the report will never show the current day’s activity.
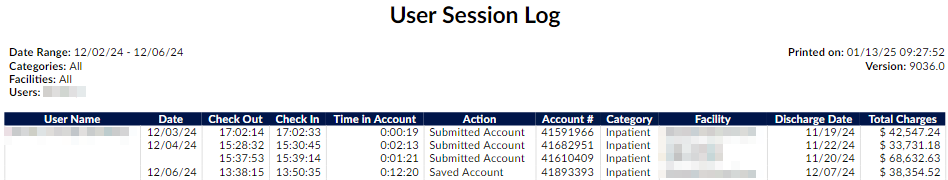
User Session Log Report
This report shows the users log showing the Checkout time (when user went into the account), Checkin time (‘Saved’, ‘Submitted’, or canceled activity in the account), and total time in the account per each account session. (Filtering: Minimum of 1 user selected; max of 7 days selected). The date range on this report is the ChangeHistory Audit Date (Check Out & Check In of the Account Dates).
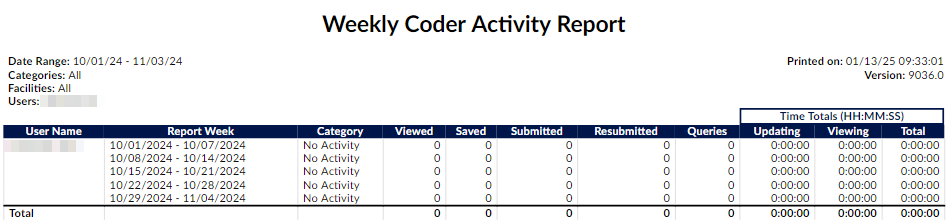
Weekly Coder Activity Report
This report shows the distinct number of accounts that were ‘Viewed’, ‘Saved’, ‘Submitted’, and ‘Resubmitted’, then the total number of Queries created, the total time updating, time viewing accounts, and total time spent per week - grouped by coder then by category (patient type) over the week range. The week range contains the date of the activity, beginning of start date to end date. (Filtering: Minimum of 1 user selected). The date range on this report is the Change History Audit Date (Viewed, Saved, Submitted, Resubmitted actions).
CDI Query Detail Report
This report provides details of physician queries created by CDI Specialists on accounts that have since been discharged. This report details how the account evolved from a Baseline DRG to a Final DRG. Any non-canceled physician query created by a CDI Specialist on an inpatient, now-discharged account should appear as a line item on this report. The date range on this report is the Chart Discharged Date. To qualify for this report the chart must be an inpatient patient type.
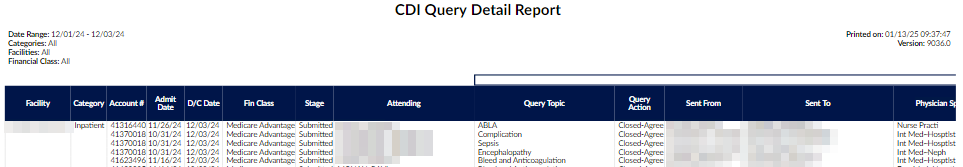
No PDF Support
Due to the number of columns, this report is not intended to be launched as a PDF.
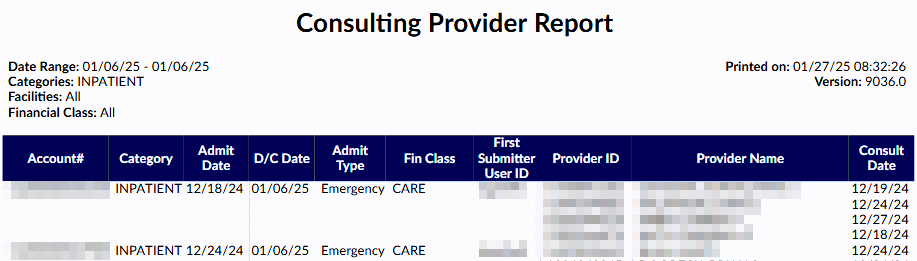
Consulting Provider Report
This report provides a list of all consulting provider(s) that were added to each account. The date range on this report is the Chart Discharged Date. To qualify for this report the chart must be Submitted and have at least one Consulting Provider.
Engine Outcome per Coder Report
This report should be used to show if the user is using code suggestions or manually adding codes. It will show total assigned codes broken down by code set along with how many codes were suggested by the engine versus added by text documents and non-text documents in addition to those that were added in duplicate. Duplicate is defined by codes that both the engine and the end-user added the code. This report card should be used as an educational opportunity to show possible improvements for the end- user and/or code suggestions. This report is recommended to be used in conjunction with an audit.
The field Total Documents had to be constrained to count the total documents on the account with at least one attached code to make the formulas correct. Documents with no codes suggested nor added are not counted in this report and should not be since this report is about engine outcome. The date range on this report is the Chart Submitted Date. To qualify for this, report the chart must be Submitted with assigned codes.
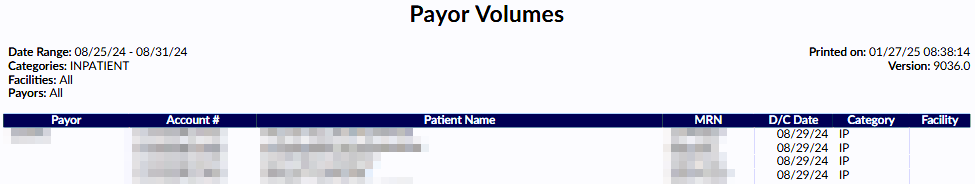
Payor Volumes Report
This report shows the submitted patient account number, full name, MRN#, discharge date, patient type, and facility - grouped by payor with number of accounts submitted subtotals and grand total over the date range. Date Range is the date the account was discharged, beginning of start date to the ending of end date. The date range on this report is the Chart Discharged Date. To qualify for this report the chart must be Submitted.
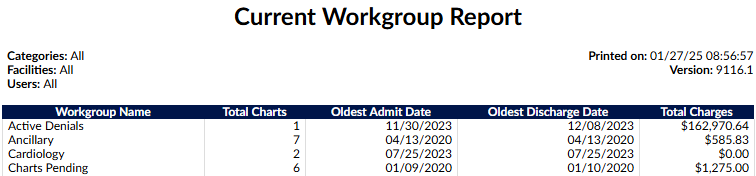
Current Workgroup Report
This report shows the list of all of the workgroups with the total charts, oldest admit and discharge date along with total charges.
Date Range not Used
The date fields below are not used for this report. The current workgroup assignments are reported.
User Filter Behavior
- If no user is filtered on this report, this report will output the current workgroup statistics for all enabled workgroups that do not have a workgroup type of “Purge” (more info below)
- If one or more users are selected as a filter, this report will output the current workgroup statistics for the workgroups that are assigned to only those users (mimicking the workgroup list that appears in the user’s personal dashboard).
- CDI workgroups can have a blank “oldest discharge date” since no accounts in CDI workgroups typically have a discharge date.
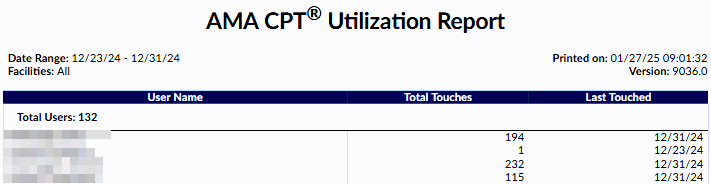
AMA CPT Utilization Report
This report lists all users who have added or edited CPT codes on accounts for a specified date range for AMA license reporting. This is a report Dolbey uses to report CPT code usage to the AMA.
Topics
User reports can be categorized by topic, per organization.
For example, the following reports might be added to a topic of Impact Reports: you are running reports.
- Physician Query Impact
- Physician Query Impact by Discharge Date
- CDI Financial Benefit
Reports can be filtered by topic to narrow down the list of available reports.
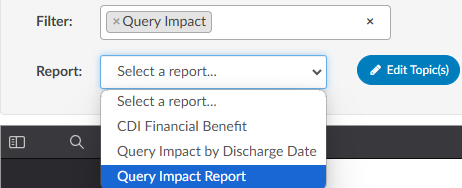
To assign a topic to report
- Select the report
- Click Edit Topic
- Edit the selected report
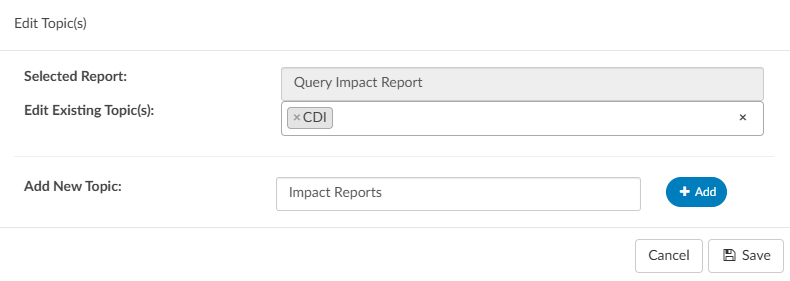
- Choose an exisiting topic from the dropdown menu
- Enter a name for a custom topic, and click +Add
- Click Save
Info
A report can have multiple topic tags.
Topics can be managed in the Topics Mapping Table.
Scheduled Reports
Reports in Fusion CAC can be scheduled to be delivered via email at specified times.
Clicking +Create New Schedule will open the scheduling options.
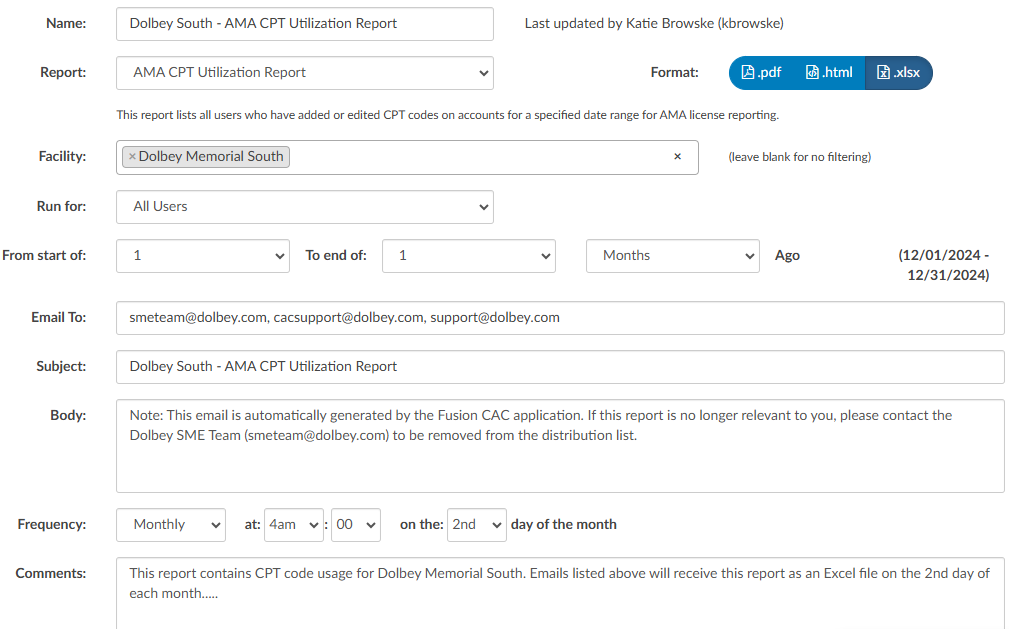
Click Save in the upper right hand corner to save the settings and start the schedule.
| Field | Purpose |
|---|---|
| Name | Name of the scheduled report that will display on the left hand side of the screen |
| Report | Dropdown list of User Reports available to be scheduled |
| Format | Format of the report when delivered to the recipient(s) |
| Disclaimer | Must be checked to acknowledge the report in question may contain PHI |
| Run For | Allows for filtering the report by role type (All Users, Auditors Only, CDI Only, Coders Only) |
| Date Range | Date range for the report. Can be set for X number of days or months in past |
| Email To | Email(s) for recipient(s). If sending to multiple people, email addresses should be comma separated. Receipients do not need to have an active Fusion CAC account to receive a scheduled report |
| Subject | Text to appear in the subject of the email |
| Body | Text to appear in the body of the email. It is recommended to include a note that the email is automatically generated and to include contact details for those who no longer want to recieve the report |
| Frequency | How often the report will be sent to the recipient(s). It is recommended to schedule reports outside of peak hours whenever possible for performance. |
| Comments | Note for management to keep track of report details. Text entered here will not be included in the email sent out |
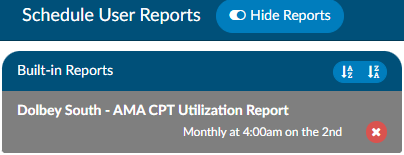
Saved reports will display on the left hand side of the screen.
Run History
Scheduled reports will have a run history.

A run history will display above the schedule data for the last three times the report ran, whether it was successful or errored. No text in the message column indicate the report ran and was delivered without error. A message of “No Message Returned” indicates nothing was sent as the report yeilded no results. The application will not send out a blank report.