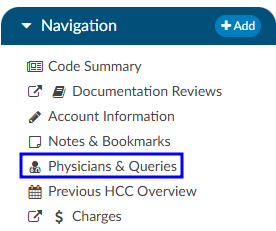
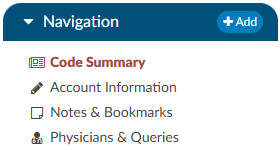
Subsections of Navigation Tree
Code Summary
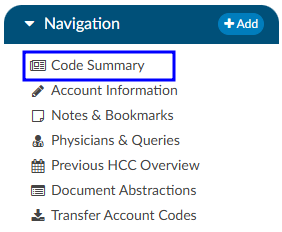
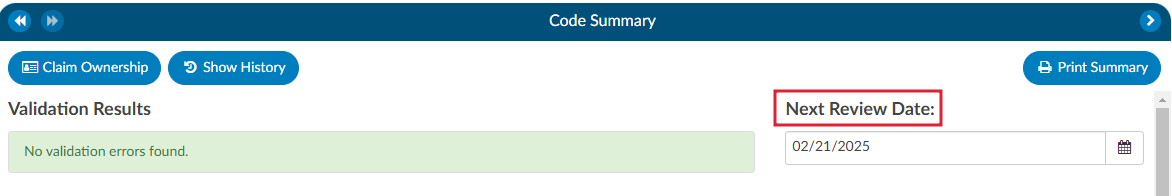
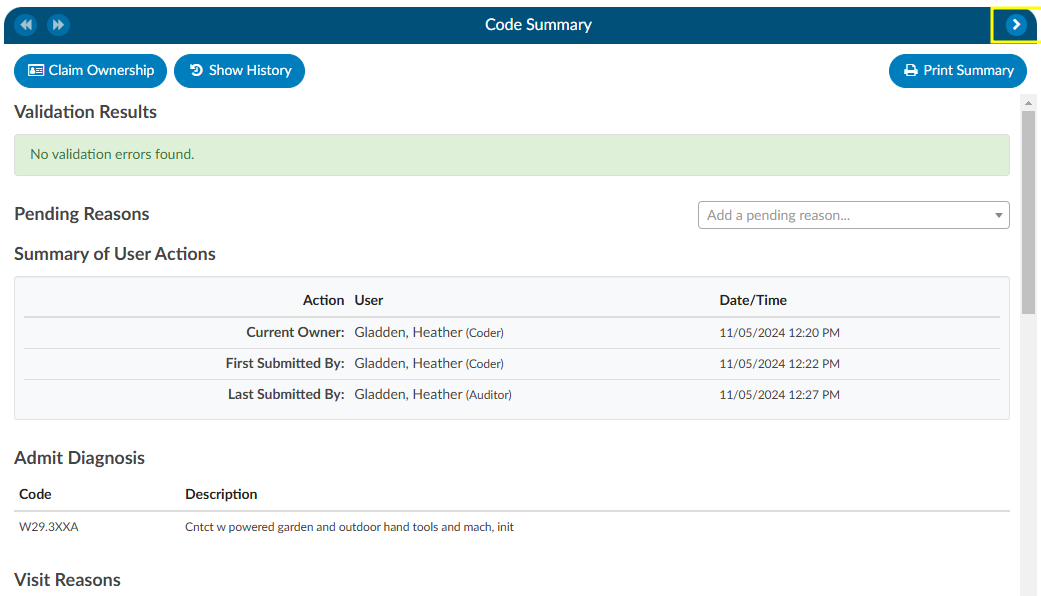
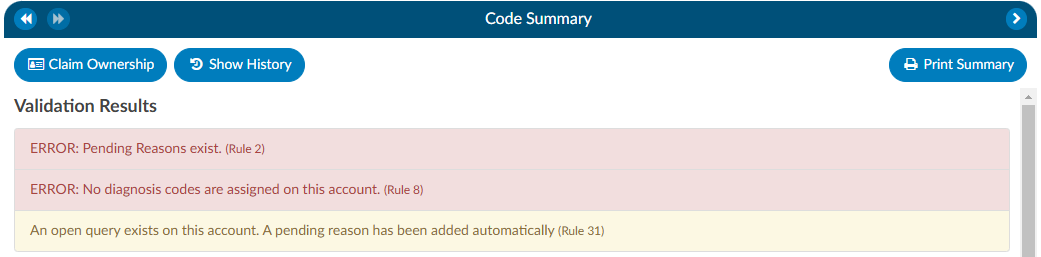
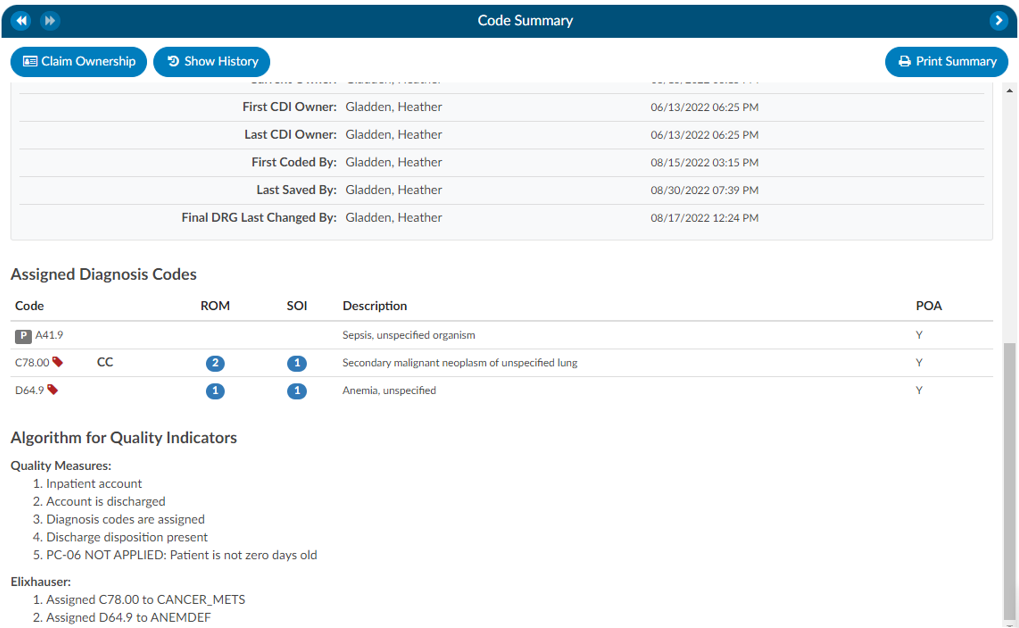
The Code Summary is the last pane to be reviewed prior to chart submission. This screen shows a summary of activity on the account and provides activity buttons to Claim Ownership, Show History, and Print Summary (if a printer is configured). This viewer also provides information on Current Owner, First Coder, Last Saver, and Last Submitter. Users can expand the width of the Code Summary pane by clicking on the arrow in the top right of the pane.
Show History
The Show History button provides a timeline view of activity on the account along with an audit trail of account activity from point of admission to the current date. It includes a visual timeline and below the timeline there will be an audit trail of account activity.
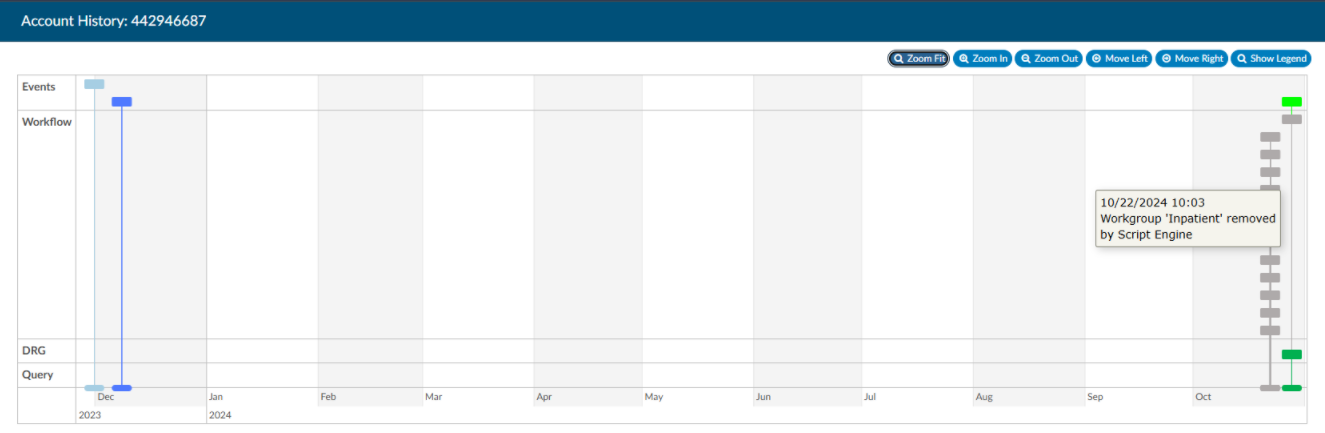
Upon opening Show History, users will see the entire history from a birds-eye view. The user has the option of using the Zoom In and Zoom Out buttons to expand or collapse the timeline. The Zoom Fit will bring the visual timeline back to its original collapsed grid. Hover over any of the event boxes and the contents will be displayed.
The legend can be found by clicking Show Legend button to let the user know what the colors represent without having to hover over them. When clicked, it will open the Legend and the button name will change to “Hide Legend”. Click again to close.
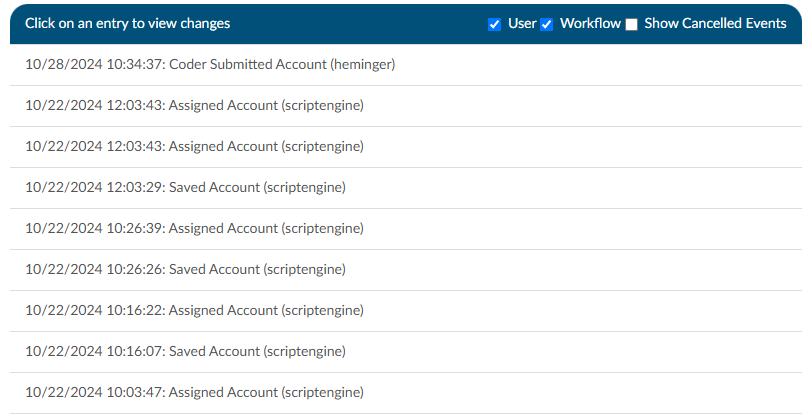
Click on an entry by date to view the changes that were made to the account on the date and time indicated.
Review Validation Results
When the Code Summary link displays RED
, there are validation errors on the chart that must be resolved prior to submission.
Any errors preventing submission of the chart will be highlighted in the box under Validation Results on the Code Summary screen. Validation Results within the chart that should be reviewed and validated before the chart is finalized and submitted for billing.
ERROR results will display in RED
. These are hard stops that will prevent the chart from being submitted. The Submit button will be grayed out until errors have been resolved, including pending reasons that have been assigned.
Warning results will display in YELLOW
. These are reminders/suggestions for the user. Warnings do not need to be resolved before submitting the chart.
Once all necessary validations results are resolved, the Code Summary link in the Navigation tree will return to black and users can hit the Submit button to complete the chart.
Pending Reasons
A list of Pending Reasons assigned to the account can be found within the Code Summary pane below Validation Results.
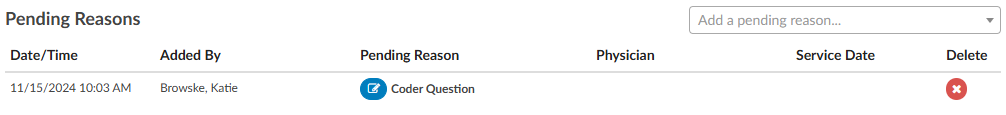
Pending reasons are used when a chart cannot be completed or routed to another Workgroup. The number of pending reasons selected is unlimited. Pending reasons will be different for each facility based on system configuration specifications. Please contact your manager for definition and use of available pending reasons.
Pending Reasons can be added to the account by clicking on the drop-down menu and selecting the applicable Pending Reason. If the organization has selected to allow a physician to be tied to a pending reason, the user will be prompted to assign a physician to the pending reason, and will see an additional physician field in the list of pending reasons.
If physicians have been turned on for pending reasons, not all pending reasons may be tied to a physician. This option is set within the mapping configuration.
If a pending reason is added to an account, the Submit button will be grayed out and unavailable. Click on the Save button to save all changes and exit the chart. Charts with pending reasons will stay within the existing Workgroup until the Pending Reason is removed. Pending Reasons can also be deleted/removed from accounts by clicking on the “X” next to the Pending Reason to be removed.
Pending Reason Notes
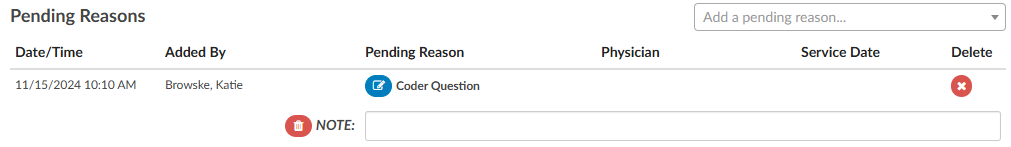
On any account, an edit button will appear to the left of the pending reason. Clicking that button will drop down a note entry where the user can record a note. Pressing ENTER will record the note. Keep in mind that a note can be deleted by clicking a trash can symbol to its left. In Account Search, the “Pending Reasons” drill down will now include the “Note” field.
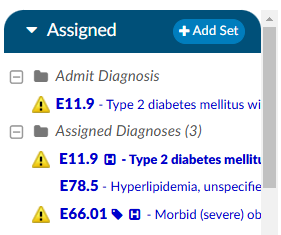
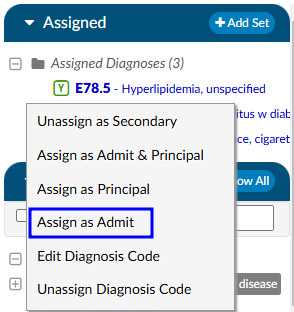
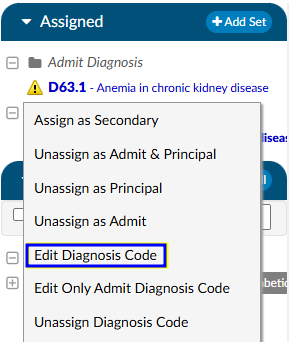
Admit Diagnosis
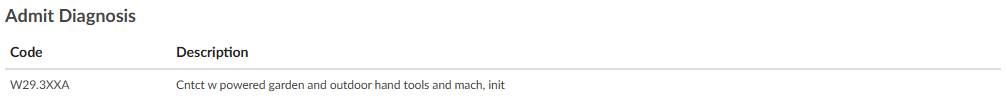
The Admit Diagnosis code and description are displayed below any Validation Results and/or Pending Reasons.
Visit Reasons
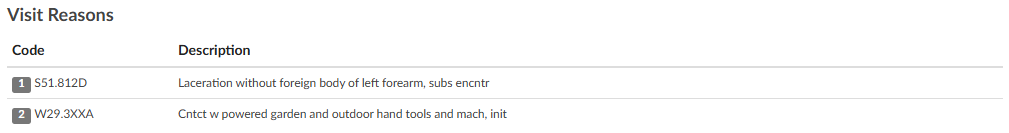
Listed beneath Admit Diagnosis are the Visit Reason codes in code sequence order. The list includes the Visit Reason code and description.
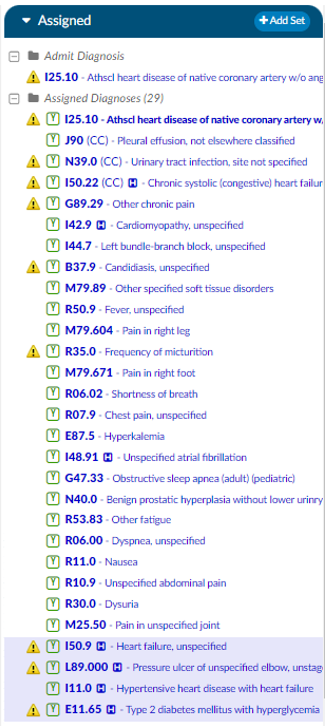
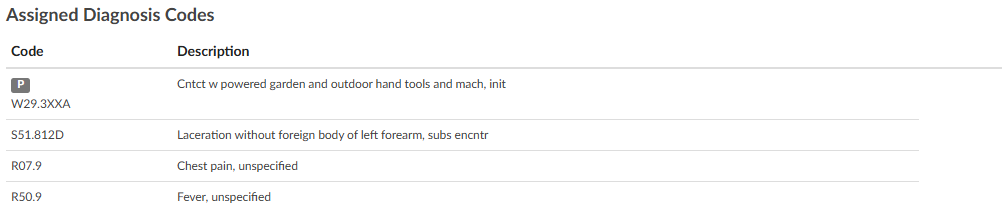
Assigned Diagnosis Codes
The Assigned Diagnosis Codes are listed in code sequence order below Visit Reasons. The listing includes the diagnosis code, description, and POA assignment (Y/N).
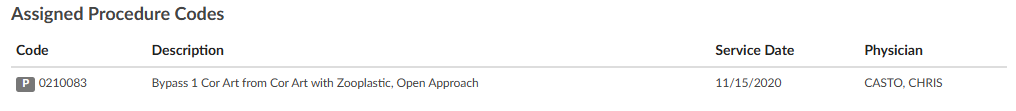
Assigned Procedure Codes
Listed beneath Assigned Diagnosis Codes are the Assigned Procedure Codes in code sequence order. The list includes the procedure code, description, Service Date, and Physician.
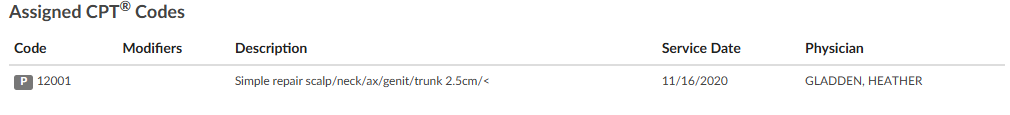
Assigned CPT Codes
Listed beneath Assigned Procedure Codes are the Assigned CPT Codes in code sequence order. The list includes the CPT code, description, Service Date, and Physician.
Print Summary
If a printer is configured for the computer, click on this button to print a copy of the abstract for this account.
Claim Ownership
Use the Claim Ownership feature based on the organization’s requirements and procedures. Consult your manager for more information on claiming ownership of a chart.
Final Code Summary
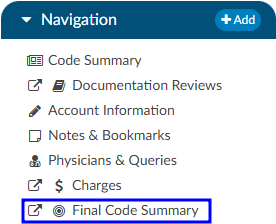
The Final Code Summary will only be available once the facility Coder clicks the Submit button. This provides transparency between CDI and physician coding teams (if also using Fusion CAC) as to what was coded. When a submitted chart is open again, users will see a new viewer under the navigation menu called the Final Code Summary. This will display what the coders coded along with code status details and sequencing. This data is viewable only for the role of ‘CDI’.
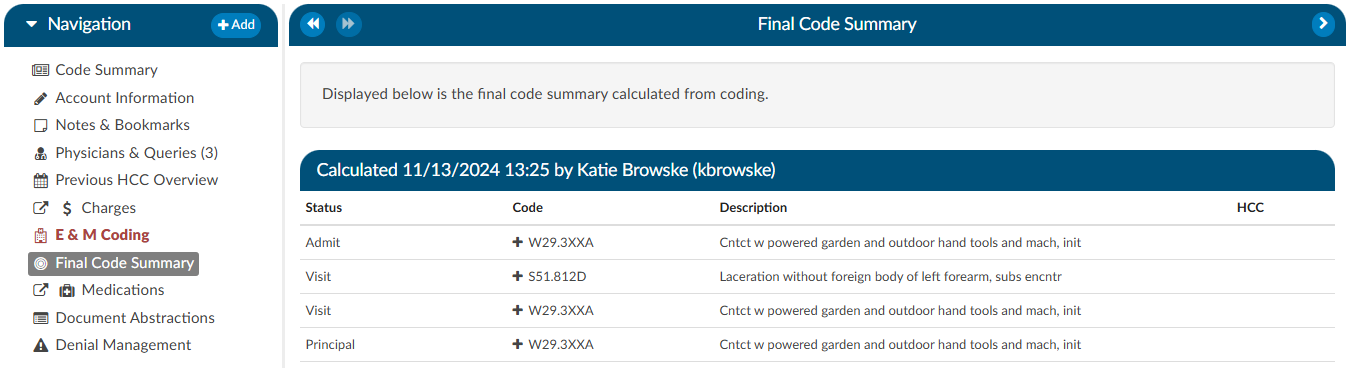
Clicking on the header will expand the selection to display the codes that were coded and DRG/APC, if applicable. Any codes with a plus (+) sign indicates the code has not been added to the account. The plus (+) sign does not indicate that the code needs to be added. It is for the user to quickly add the code if they determine it is needed using coding judgment and supporting documentation. If applicable, the code’s HCC designation will show the HCC number and its version.
Physician Coding Summary
The Physician Code Summary will display if the Physician Coders are also coding within Fusion CAC, and they submit the chart. This provides transparency between the facility and physician coding teams as to what was coded.
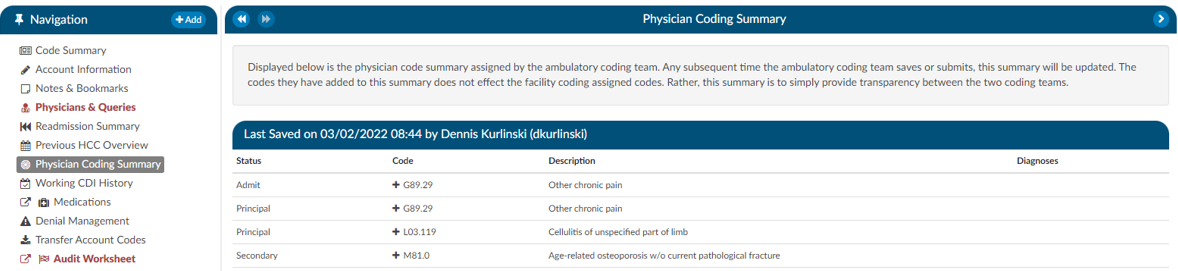
Clicking on the header will expand the selection to display the codes that were coded. Any codes with a plus (+) sign indicates the code has not been added to the account. The plus (+) sign does not indicate that the code needs to be added. It is for the user to quickly add the code if they determine it is needed using coding judgment and supporting documentation.
Subsections of Code Summary
Quality Indicators
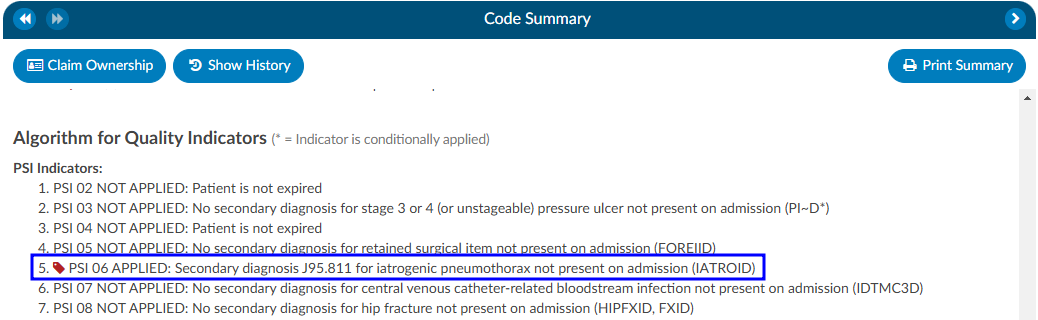
In the Code Summary Viewer at the bottom, you’ll find the Algorithm for Quality Indicators, which outlines the methodology used to identify Pediatric Quality Indicators (PDI), Patient Safety Indicators (PSI), Quality Measure PC-06, and Elixhauser Measures.
PSI Indicators
The PSI Module uses the PSI technical specification from Agency for Healthcare Research and Quality
U.S. Department of Health and Human Services from www.qualityindicators.ahrq.gov.
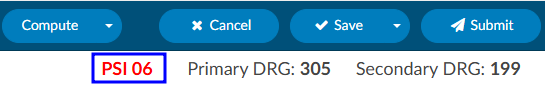
Fusion CAC leverages the codes from the assigned code tree, along with other relevant patient data, to determine whether specific quality measures are met. Fusion CAC provides an indicator on the banner bar when codes coupled with patient demographics meet a PSI guideline.
The PSI is reported in one of two fields CDI PSI Indicator or PSI Indicator. The indicator can be used for workflow and/or reporting. When a PSI is applied to an account it will display in the algorithm section of the Code Summary viewer. A red tag will display next to the applied PSI for visibility.
PDI Indicator
The PDI Module uses the PDI technical specification from Agency for Healthcare Research and Quality
U.S. Department of Health and Human Services www.qualityindicators.ahrq.gov.
The Pediatric Quality Indicators (PDIs) focus on potentially preventable complications and iatrogenic
events for pediatric patients treated in hospitals and on preventable hospitalizations among pediatric
patients, considering the special characteristics of the pediatric population.
This PDI indicator displays in the banner bar under the compute button. The PDI is reported in one of two fields CDI PDI Indicator or PDI Indicator if identified. The indicator can be used for workflow and/or reporting.
The algorithm for the PDI on if it applied or not is within the code summary pane.
If a code that causes an exclusion for a PSI or PDI occurs in the top 25 codes (or custom limit set by the organization) the PSI/PDI will show in the banner, with an asterisk next to it, to indicate the PSI was conditionally applied. The algorithm at the bottom of the Code Summary viewer will show the reason why.
PC-06 Indicator
The Quality Measure Module supports the PC06 measure and uses the Joint Commission technical
specification https://manual.jointcommission.org/releases/TJC2018B/MIF0393.html.
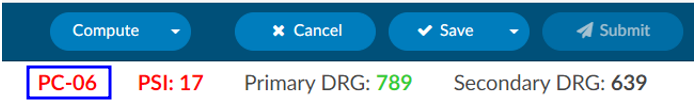
Fusion CAC uses the codes from the assigned code tree along with other patient data that meet each PC-06
guideline. Fusion CAC provides an indicator on the banner bar to a coder when codes coupled with
patient demographics meet a PC-06 guideline. The indicator can be used for workflow and/or reporting.
Elixhauser Comorbidity Measure Indicator
The Elixhauser Comorbidity Index is a method of categorizing comorbidities of patients based on the
International Classification of Diseases (ICD) diagnosis codes. The indicator can be used for workflow
and/or reporting.
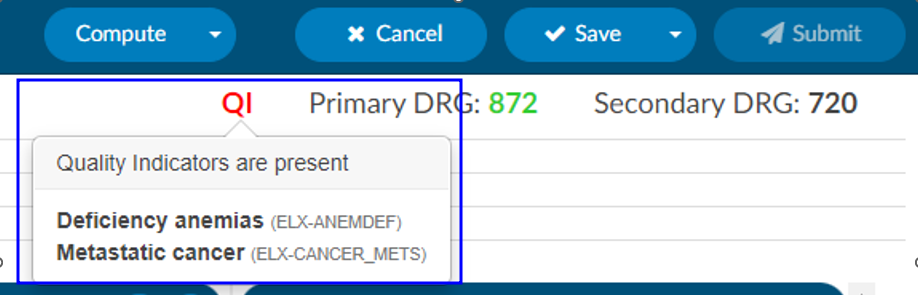
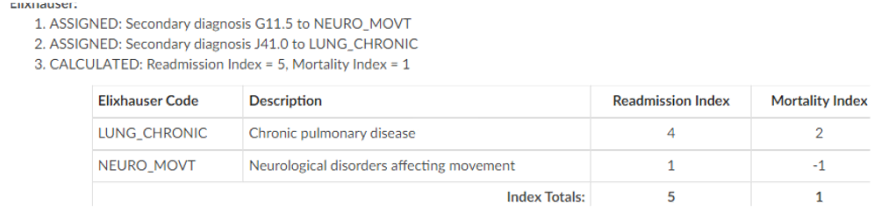
The algorithm to determine the Elixhauser measure can be found on the code summary at the bottom under the assigned codes. A table under the Elixhauser section of the Code Summary sheet will appear, showing weight totals for each item that triggers.
The Account Information viewer summarizes patient demographic information (based on custom system configuration) with data captured for purposes of state and/or registry reporting. To update data fields in the Account information pane, click on the blue button and select the appropriate selection from the drop-down menu.
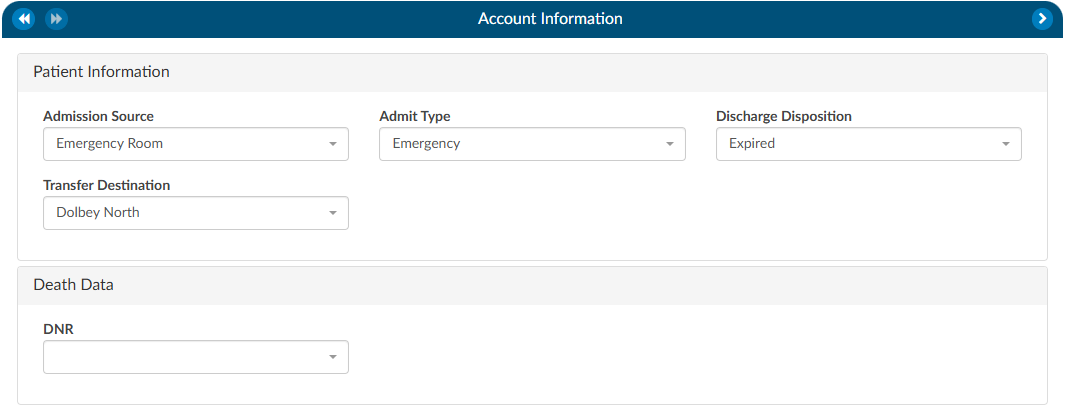
Users can expand the width of the Code Summary pane by clicking on the arrow in the top right corner of the pane.

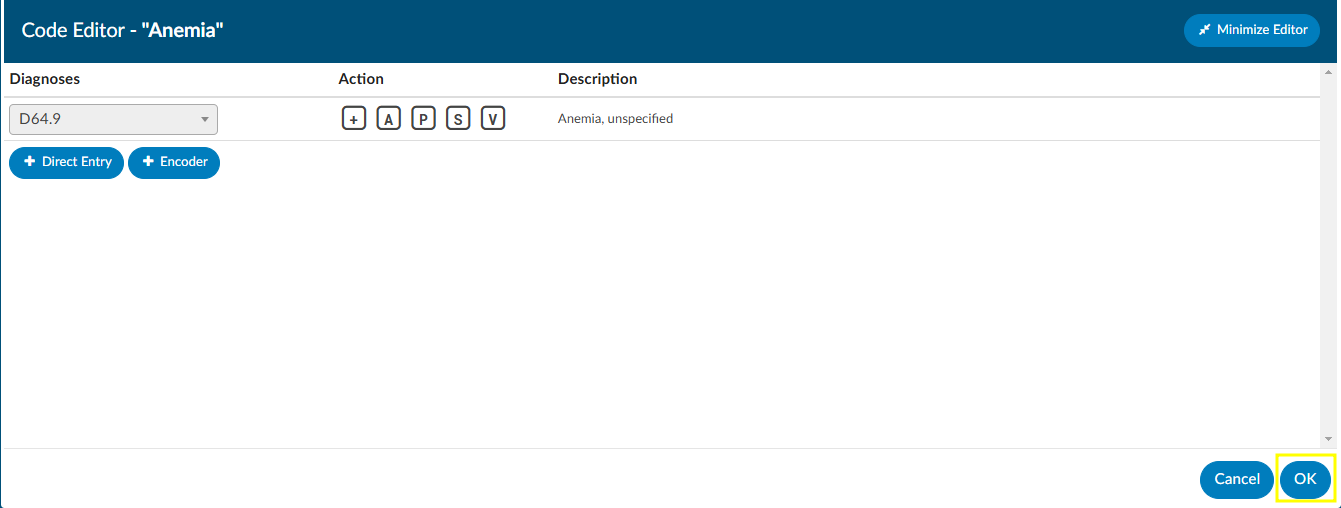
Unspecified Code Edit Flag
On April 1, 2022 CMS made the Unspecified Code Edit effective. This new edit is triggered when a code from the unspecified code list is assigned by a coder. It is the provider’s responsibility to determine if a more specific code from that subcategory is available in the medical record documentation by a clinical provider.
If additional information to identify the laterality from the available medical record documentation by any other clinical provider is unable to be obtained, or there is documentation in the record indicating that the physician is clinically unable to determine the laterality because of the nature of the disease/condition, then the provider must enter that information into the remarks section.
Specifically, the provider may enter “UNABLE TO DET LAT 1” to identify that they are unable to obtain additional information to specify laterality or they may enter “UNABLE TO DET LAT 2” to identify that the physician is clinically unable to determine laterality. If not entered, the claim will be returned.
Fusion CAC/CDI can support the addition of this field to your account information viewer and send the necessary information, known as the billing note, downstream if required. If this is something that you need, please reach out to the Dolbey SME Team at smeteam@dolbey.com.
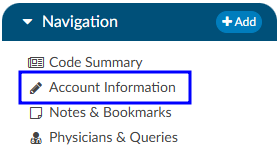
Notes & Bookmarks
The Notes & Bookmarks becomes visible in the center pane after clicking on the hyperlink from the Navigation tree. This tree presents a summary and chronological history of all notes and bookmarks added to an account. Users can expand the width of the Code Summary tree by clicking on the arrow in the top right corner of the tree.
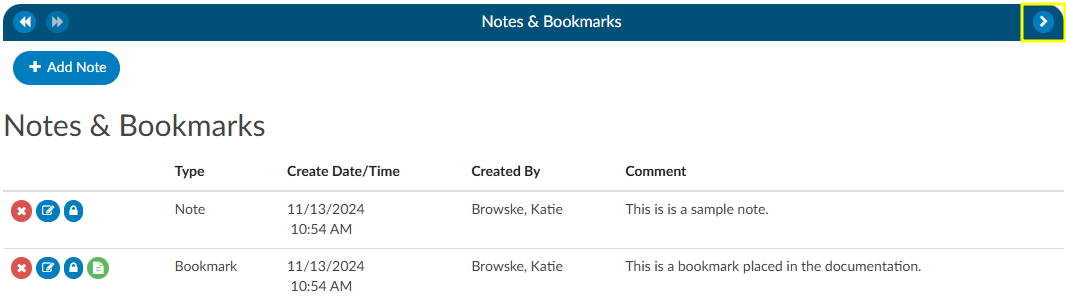
Notes
Notes can be added to the patient chart by clicking on the +Add Note button within the Notes & Bookmarks viewer.

When notes or bookmarks are applied to the chart, the Notes and Bookmarks link in the Navigation tree will turn red.
Account Notes also have formatting options for text. Highlighting the text displays a pop-up with formatting options. A user can now select text in those areas and can change the styles of text.
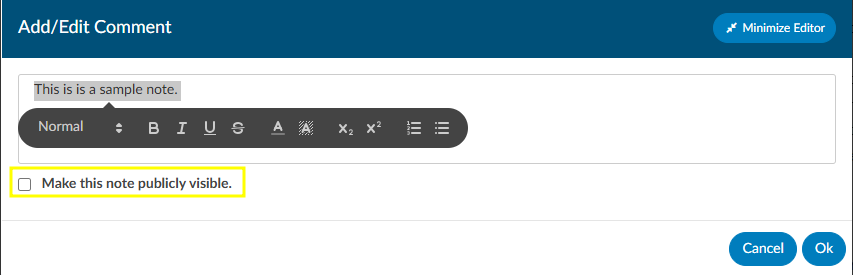
Users have the option to make notes publicly visible among all users by clicking on the checkbox. Even if an end user marks a note/bookmark as private, users with the role of administrator or manager can still see private comments. This feature allows for a manager to review a patient chart and if they do not want the existing public note to show in the account note, they can change an existing note to private without putting in a new note. Then they have to make it public, then switch it to private in order to have the account note blank.
To keep your Comment box open while continuing to work on the chart, click on the Minimize Editor button. This will move a placeholder to the Accounts Action Bar.


Bookmarks
Users can add a bookmark to a document by highlighting the relevant word(s), phrase or location within the text and then right-clicking to open the Bookmark menu.
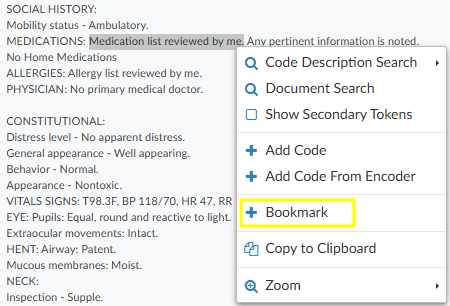
From the Bookmark menu, select Bookmark to open the Note window to add your note for this bookmark.
Add the note for your bookmark in the Note text box, then click the checkmark button to save the bookmark with your note for future reference. Bookmarks within documents will have the bookmark icon. To view bookmarks from within a document, click on the green icon to open and view the bookmark note.

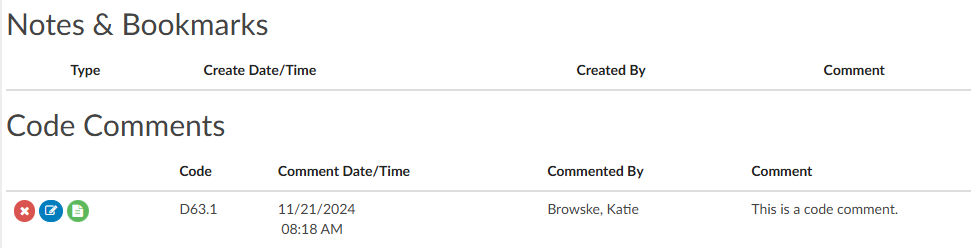
To review all bookmarks within a chart, go to Notes & Bookmarks in the Navigation tree. All of the bookmarks within the chart are listed in the Notes & Bookmarks viewer.
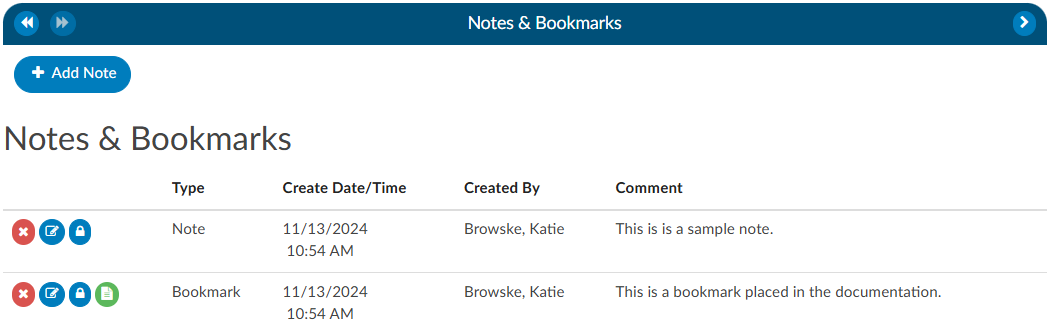
The RED X
button will delete the selected bookmark.
The BLUE PENCIL
button is used to edit a previously added bookmark.
The GREEN PAPER
button will jump to the location where the bookmark was created.
Physicians & Queries
Within this viewer users can add physicians and change the physician’s staff function, if necessary. They can also intiaiate the physician query process in this viewer. Users can expand the width of the Physicians & Queries pane by clicking on the arrow in the top right corner of the pane.
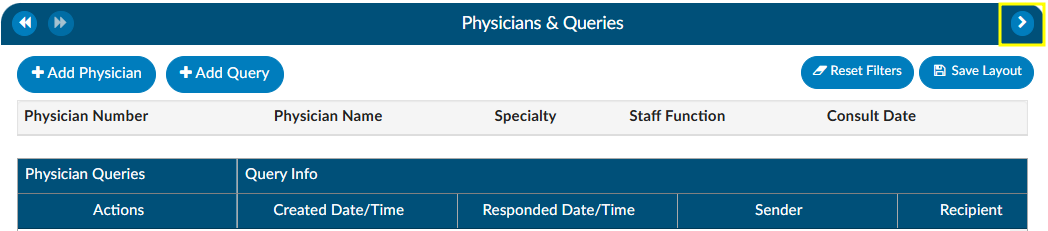
Adding/Editing Physicians
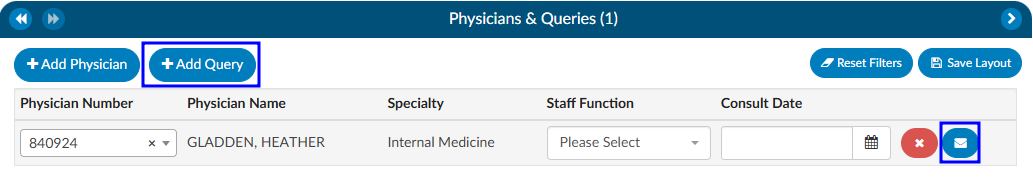
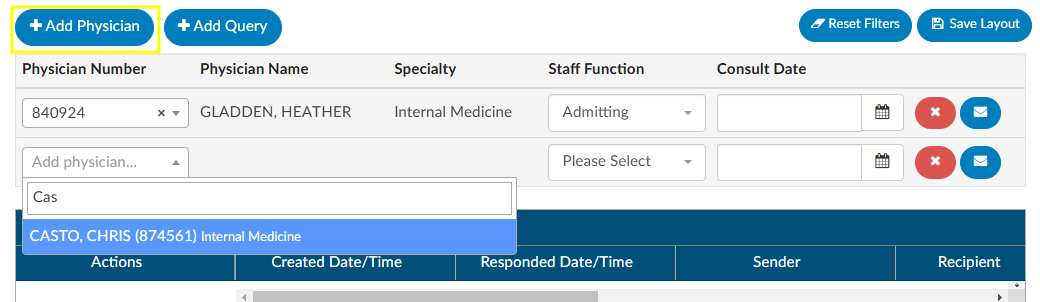
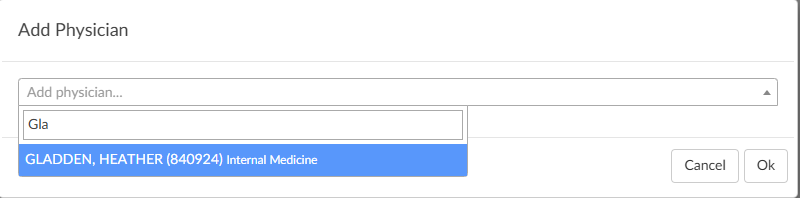
The are several fields that are pre-populated by the organization’s registration system including “Physician Number”, “Physician Name”, “Specialty” and “Staff Function”. Physicians can be added, changed, or removed if incorrect or missing. To add a physician, click on the +Add Physician button and begin typing in the physician’s last name to populate the correct physician. Choose the staff function that fits the chosen physician. If it is a consulting physician, also enter the consultation date.
To remove a physician that either you added or was sent incorrectly from the registration system click on the RED X button to remove the physician.
Querying a Physician
Adding a Query
There are two ways to add a query to a physician that is listed. The first is to click on the BLUE ENVELOPE
icon next to the physician.

The second way is to click on +Add Query. This would also be how to query a physician that is not already listed.
When a physician is listed, the query will auto-populate the physician name. If a physician was not already listed, simply begin typing in the last name in the “Physician” field by entering two or more characters to find the correct physician name.
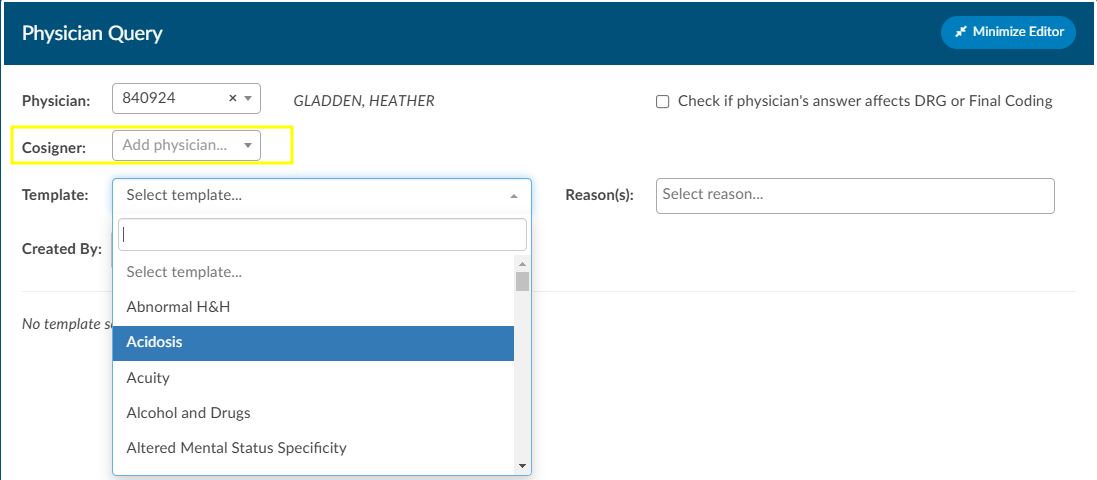
If configured, users can see a cosigner field that allows assignment of a cosigner. The cosigner field is a field that can be sent in the outbound interface for the query. The receiving system can choose to use this process if the cosigner needs to receive the query after the main recipient answers, but before it gets returned to Fusion CAC. When a physician query is created, a new “Cosigner” physician dropdown appears below the existing “Physician” dropdown. Filling in this field is optional. When the query is saved as a draft or sent outbound, the cosigner field will be saved with the query and sent as an additional recipient. In the grid inside the Physicians & Queries, the user may also choose to add “Cosigner” as a visible column.
Continue through the query build by selecting the query template.
Write the query or fill out the template details as needed.
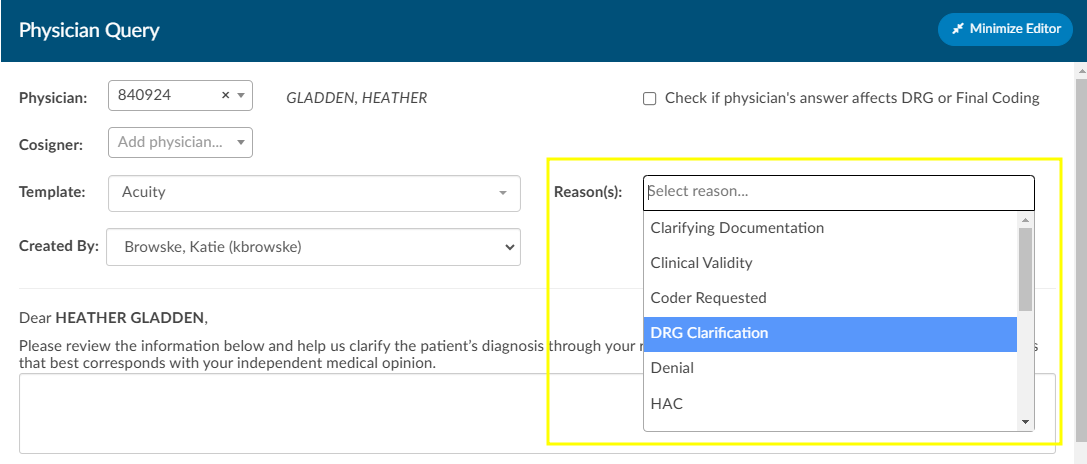
Once completed, select from the reason dropdown why the query is being sent, and above that field, check the box if the query will affect final coding.
Checkbox
The checkbox “Check if physician’s answer affects DRG or Fincal Coding” will not be visible to providers.
Query Impact Codes
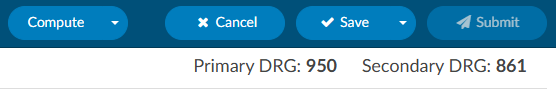
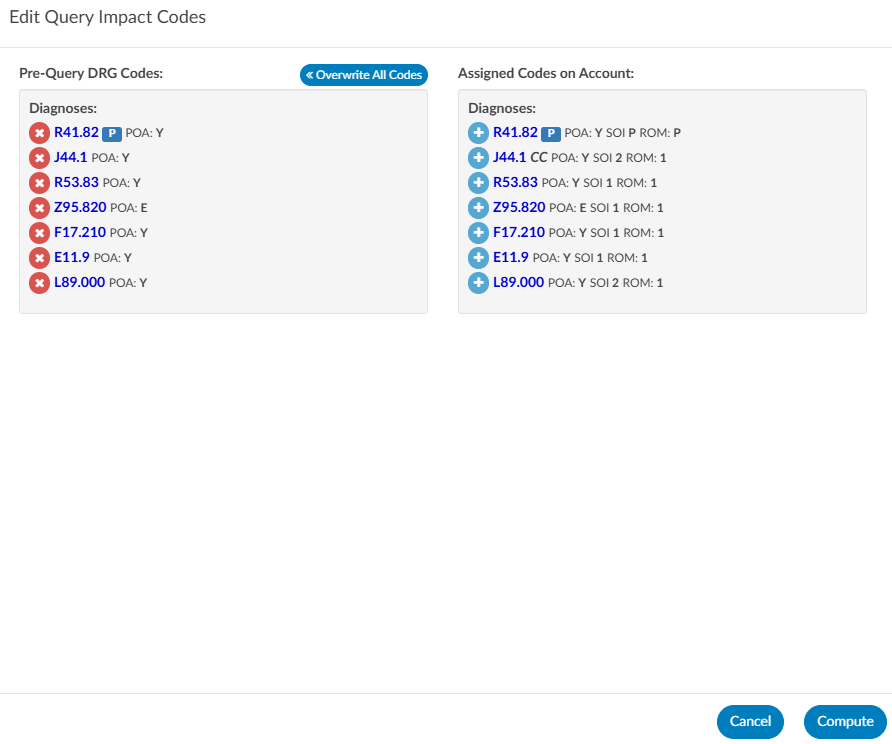
Before sending the query, the user will see a Compute button below the template name. When this is clicked, a Edit Query Impact Codes dialog box will open. Here, the user can add or remove assigned codes that should be associated with the DRG when they compute the Pre-DRG. Clicking on the Overwrite All Codes button will associate all of the assigned codes. Once the pre-query DRG is completed users will follow the standard process to send the query.
Prior to closing a query, when the query has been responded to, open the query to complete it by clicking the RED ENVELOPE icon. Users will be able to compute a Post-DRG in order to capture impact. The previous DRG will auto-populate (unless the user added, deleted, or changed any codes, re-sequenced or changed the discharge disposition). If the Pre-DRG does not populate, it will need to be calculated again by clicking the Compute button next to the Pre-DRG. Users will now also see a Compute button for a Post-DRG below the template name. Users can minimize the query as needed to add, delete, or otherwise change any codes before clicking compute.
Sending a Query
Click Send to Physician to complete the query and send it, or click Save Draft if the query is not ready to be sent. If the query is saved as a draft, a draft query section will appear that is separate from sent or closed queries. If a user has at least one draft, but no sent queries, the total drafts count on their personal dashboard will display as zero.


Alternatively, for organizations who do not have a physician query interface AND do not create a physician query until a response is received, a query can be created and not sent. When enabled, a physician query will show a Continue button in place of Send. Clicking Continue will refresh the query to open the physician response fields so that the query can then be closed.
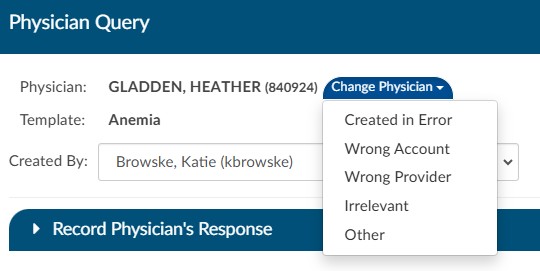
Editing a Sent Query
The physician the query was orginally sent to can be changed after sending the query by opening the query and clicking Change Physician. A dropdown will appear so the user can select the reason the physician needs to be changed.
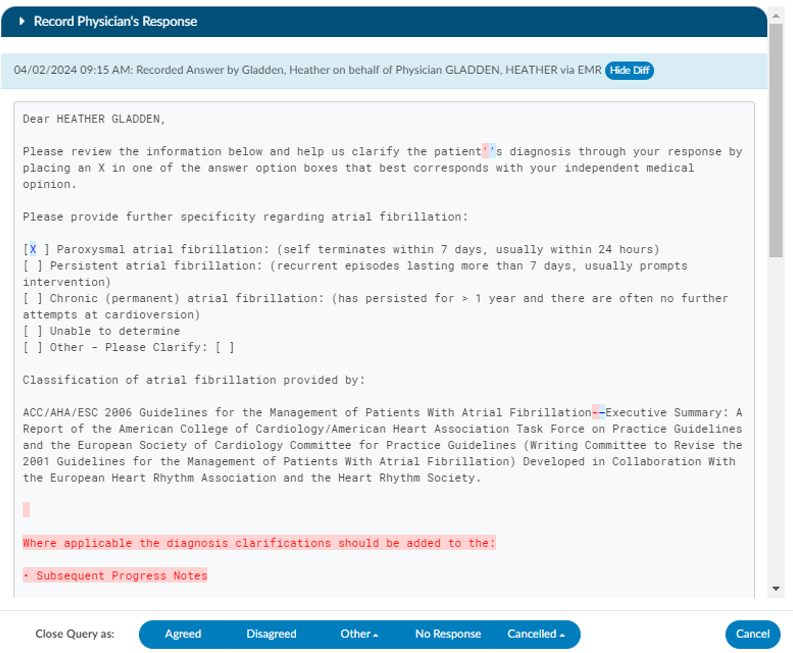
Closing a Query
To close a query—whether to review a response and update the outcome or to cancel it—simply click the RED ENVELOPE
icon. If a response from the provider is available, clicking the icon will open the query to display it.

The user can then choose how to close the query using options in the screenshot below.

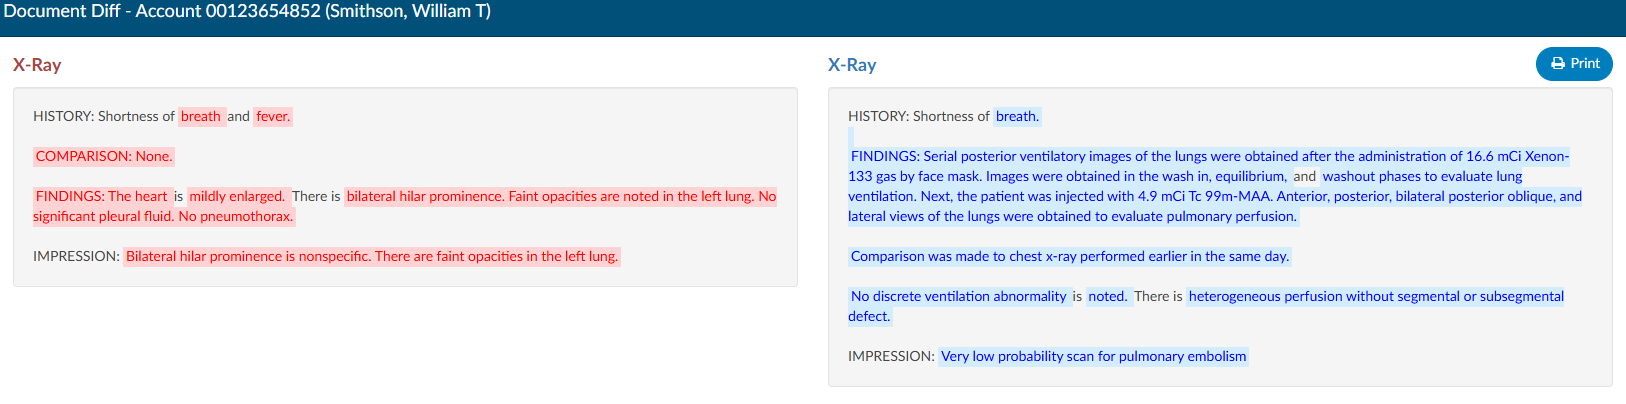
Query Response Show Diff
The physician query has a “Show Diff” toggle above physician query responses in the Physician Query dialog. Clicking it will show additional text in blue highlighting and deleted text in red highlighting. When the diff is shown, the button changes to “Hide Diff,” which when clicked will show the unaltered response.
Diff Logic
If your organization has an interface that imports the physicians response, the diff logic may report false positives and false negatives, like changes from double quotes to single quotes or the addition/deletion of blank lines.
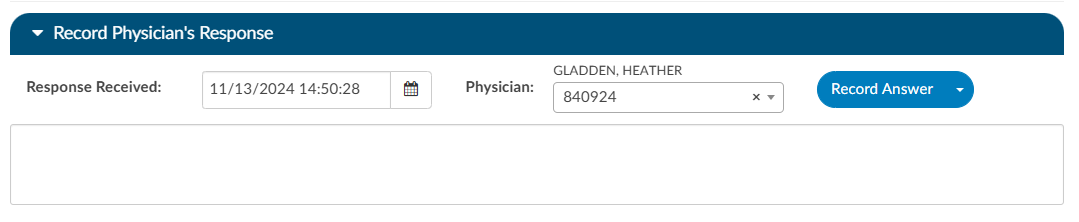
Once a query is opened and responded (or the user is recording the response on behalf of the physician), the responding physician and the date/time of the response can be editied. If the organization is manually closing queries, this information ensures that the management reports reflect accurate turnaround times.
If an organization has choosen to collect shift reasons, a dialog box will appear upon selecting an outcome for the query.
Documenting Query Shift Reasons
Shift reasons can be categorized as either automatic or manual. If manual shift reasons are enabled, users will encounter a dialog box after closing a query.
Inpatient Query Shift Reasons
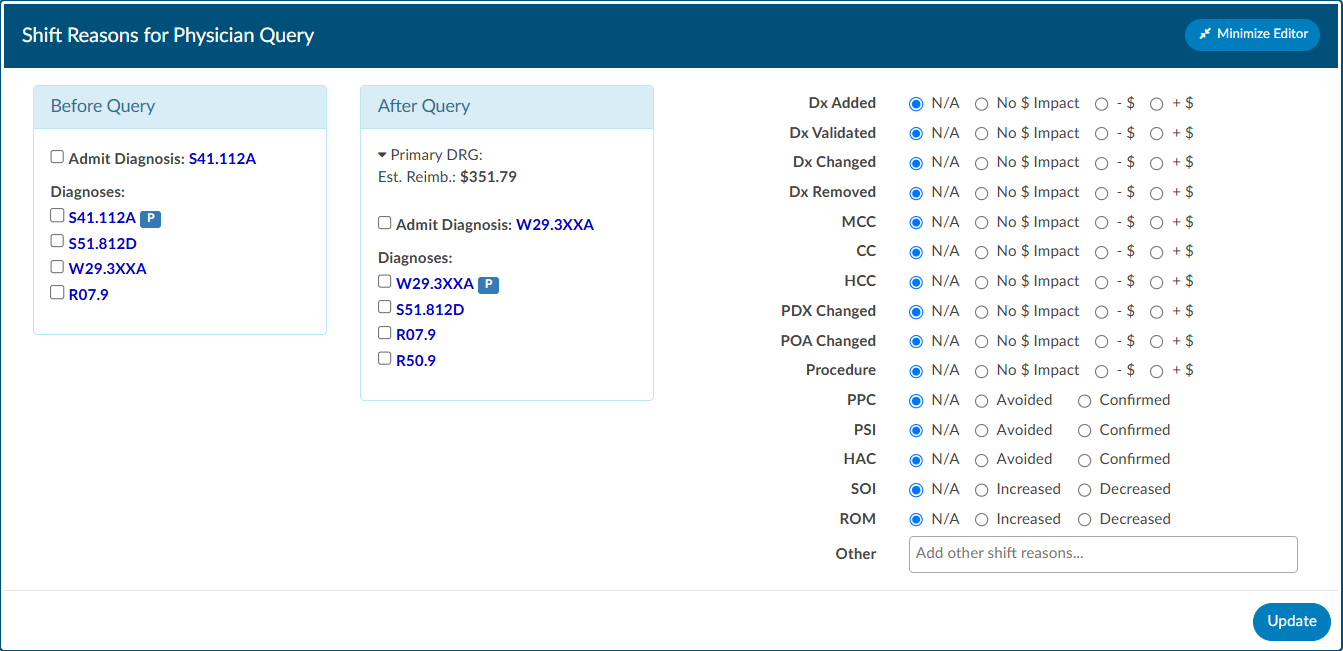
Outpatient Query Shift Reasons
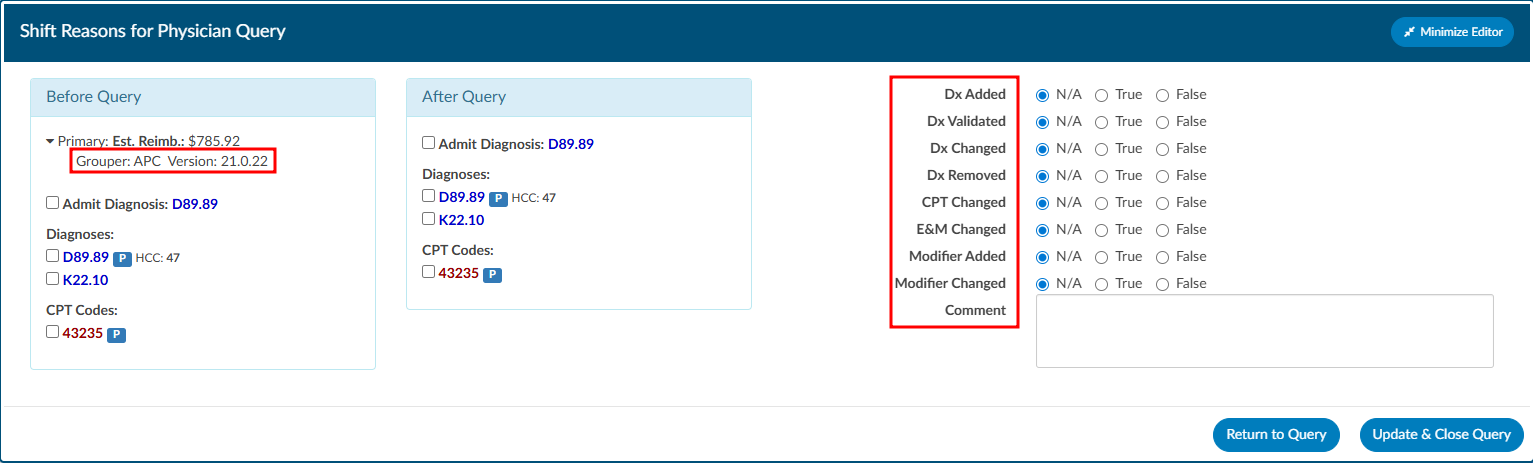
This dialog box will display the pre and post-query DRG/APC (if applicable) along with options for shift reasons. These shift reasons can be chosen by the end user to explain the rationale behind the change in the DRG/APC. It is important to note that changes in the DRG/APC might occur for reasons unrelated to the query outcome. Please be aware that the shift reasons dialog is customizable, so each organization may offer different options than what is shown in the screenshot.
Automatic vs Manual Shift Reasons
The dialog box will only display if shift reasons are set to manual. Organizations looking to enable or disable the dialog box, should contact CAC Support (cacsupport@dolbey.com)
Placeholder Queries
Some organizaitions create a physcian query within Fusion CAC and then copy and paste it into a different system rather then send them through an interface. Dolbey refers to this as a place holder query for reporting and transparencey. A feature can be enabled so that text entered into fields on the place holder query will no longer display in bold. To activate this option, please contact CAC Support (cacsupport@dolbey.com).
Quick Complete
The Quick Complete query feature is designed for sites that create placeholder queries ONLY. This feature allows a user to log a query without sending it externally. The user can assign a provider, template, reason, and both pre and post-DRG information along with closing the query with shift reasons all in one session. This quick complete feature aims to streamline these actions into a single, integrated process. This feature is optional and needs to be turned on. Contact CAC Support (cacsupport@dolbey.com) to enable this feature.
Once enabled, create a new physician query, and notice a new Quick Complete button in the footer. Clicking it will automatically save the query and reopen it with “Record Physician Response” expanded to record a physician’s response. The Quick Complete button only appears on new queries, including queries opened from drafts. It will not appear if a query is edited or if a query’s physician is changed.
Query Status
The status of the query will display in the actions column on the query grid. The following are status options:
| Status | Description |
|---|
| Open | This query has been sent, but not yet responded to by the provider. |
| Answered | This query has been sent and has received a response, but has yet to be closed by the end user. |
| Canceled | This query has been canceled by the end user. The status column will display the reason for the cancellation. |
| Closed | This query has been closed by the end user. The status column will display the outcome of the query. |
Canceling Queries
Not all organizations support canceling physician queries. Redirected queries may still need to be canceled within the EHR. Consult your supervisor to learn if additional steps need to be taken to cancel a query.
Per User Settings
This grid will display key details about the query, including the creator, recipient, creation date, reply status, and response timestamp. Columns can be reordered based on user preference. When moving around the columns in the Physician Queries grid and then clicking the Save Layout button, the columns and order will be saved for the Queries grid for all future accounts for that user. Any other user will see the default layout. Next to the Save Layout button is a Reset Filters button, this will take any custom layout and change it back to the default fields.
If the organization chooses to use signatures when sending queries, automatic signatures can be addended to the query. Signatures can be editied within each user’s profile.
Note
Please refer to your supervisor for details as each organization has custom query templates and additional details surrounding queries.
Calculating Query Impact
Query Impact = Pre-Query Working DRG Weight – Post-Query Working DRG Weight
Query impact is calculated using the Working DRG calculated within the same session in which the physician query was created. Once the physician replies to the query, the CDI will close the query. During the session the query was closed, the system will then capture the Working DRG that was calculated. A session is closed by saving the chart.
If a physician query shifts the assigned DRG, diagnosis, procedures, CC/MCC/HAC/ROM/SOI or Quality
metrics, the shift reason is automatically calculated by the system. The shift reason is captured by looking at the difference between the last Working DRG and the current Working DRG as well as the Code Sets difference in the most current Working DRG. Code sets will be automatically captured for reporting.
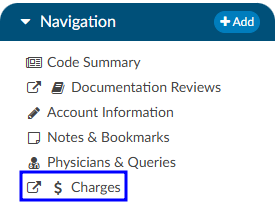
Charges or Transactions
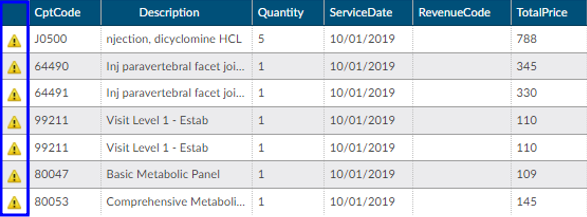
If an interface for account charges or transactions is set up during configuration, the Charges screen shows a listing of charges on the account.
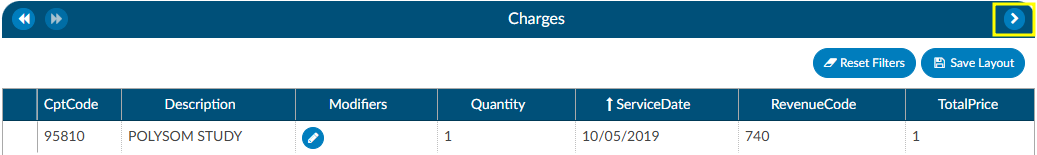
There are activity buttons to “Save Layout” or expand the Charges viewing pane. Users can expand the width of the Charges pane to view more available columns by clicking on the arrow in the top right corner of the pane. This pane also provides information on CPT Codes, Descriptions, Modifiers, Quantity, Service Date, Revenue Code, and Total Price.
Column Settings
Each column within the Charges grid has menu options to Pin Column, Autosize, and Reset Columns. Click on the Menu icon to view the drop-down listing. After making column setting selections, click on the button to retain column settings for future coding sessions.
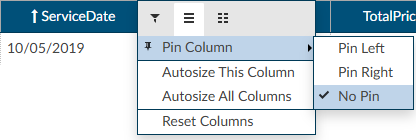
| Column Setting | Definition |
|---|
| Pin Column | Allows users to select the column and then pin it to the RIGHT or LEFT side of the assigned accounts grid. This function works similarly to freezing columns in Excel. |
| Autosize This Column | Select this option to change the column width to automatically size the width of the column for contents of the cells in this column. |
| Autosize All Columns | To quickly autosize all columns in the assigned accounts grid, click the Autosize All Columns button. |
| Reset Columns | Click on this option to Reset Columns to their default column width. |
Adding Modifiers to Charges
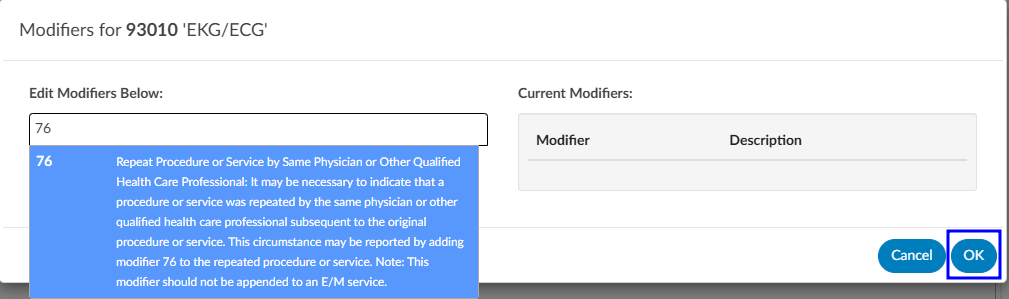
Click on the BLUE PENCIL
button to open the Modifiers window. Start entering the digits for the modifier to bring up the drop-down listing of available modifiers and their descriptions to select the appropriate modifier. After the modifier is in the window, click on the OK button to save the selected modifier. Continue this process to add all applicable modifiers to charges in the Charges pane. The user can add up to four (4) modifiers unless they are using the Solventum CRS encoder, then they will be able to add up to five (5) modifiers.
Editing Hard Charge Details (Physician Coder)
A user with the role of a Physician Coder can now add assigned diagnosis codes along with physicians and CPT Modifier codes to hard charges listed in the Charges viewer. When a Physician Coder opens the Charges viewer, new columns with edit buttons will be seen.
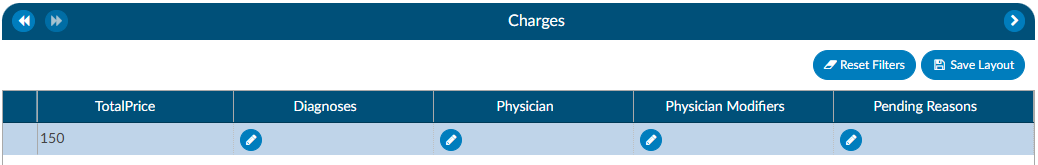
Clicking on the BLUE PENCIL
button in the Diagnosis column will open a code field, which when dropped down, will list all assigned diagnosis codes on the account. The Physician Coder can then select which diagnosis code(s) to attach to the hard charge. The top most diagnosis code of a charge is designated the “principal” diagnosis. If you add or remove codes, whatever code is listed first is the principal – the principal code on a charge can be different than the principal code on the account. If a user moves the codes around, the top code will always become the primary code.
Clicking on the BLUE PENCIL
button in the Physician column will open a physician field to allow the selection of a physician. This is the same for the Physician Modifiers column which will open a modifier window allowing modifiers to be selected. When launching the encoder, the physician coder’s modifiers will be sent instead of the final modifiers in the Charges viewer.
Clicking on the BLUE PENCIL
button in the Quantity column will open a field to allow the end user to enter a new value for the quantity of the charge. The dialog will perform validation so that invalid quantities are not recorded such as letters, blanks, and/or a zero quantity. Negative quantities are permitted. Decimal quantities are permitted.
Note
The organization must have physician coding enabled to use this feature, if you do not have physician coding please contact your account representative for more information.
Assigning a Pending Reason per Charge (Single Path & Physician Coder)
Users that have a Physician Coder or Single Path Coder role will have the ability to place a pending reason per charge on the physician charges.
- If a charge is removed, then the pending reason would be removed.
- If a charge is updated, then the pending reason would not change.
Caution Column (TruCode)
A Caution Column is avaialble for sites that use the TruCode Encoder to the Charges and Transactions viewers. This column will indicate a flag if TruCode reports an edit on a charge on an outpatient account.
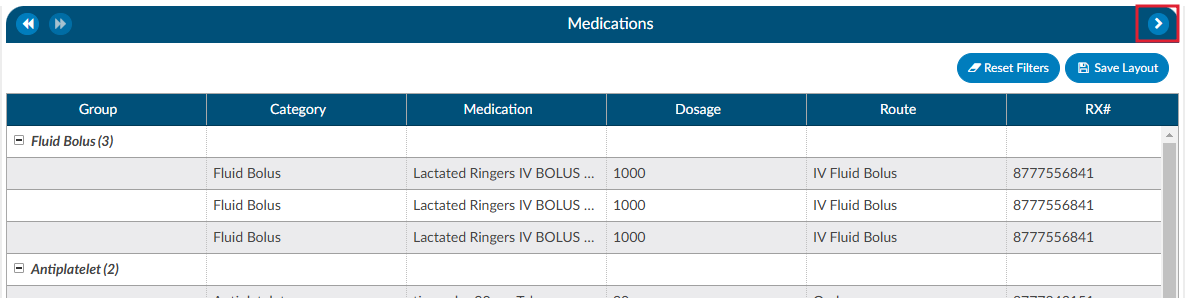
Medications
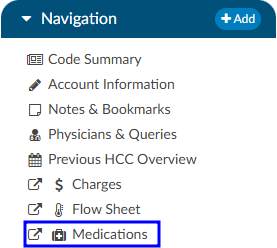
A Medication Administration Record (MAR, or eMAR for electronic versions), commonly referred to as a drug chart, is the report that serves as a legal record of the drugs administered to a patient at a facility by a health care professional. The MAR is a part of a patient’s permanent record on their medical chart. The health care professional signs off on the record at the time that the drug or device is administered.
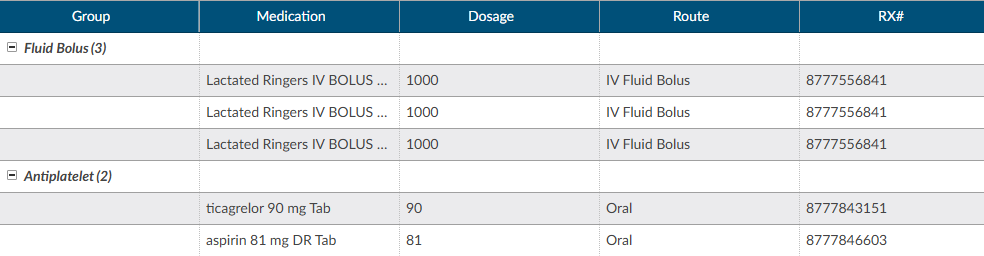
There are activity buttons to “Save Layout” or expand the Medications viewing pane. Users can expand the width of the Medications pane to view more available columns by clicking on the arrow in the top right corner of the pane. This pane also provides columns that can be sorted or filtered based on the user’s need. The columns include the medication Group, Category, Medication name, Dosage, Route, Rx#, Start Date/Time, and End Date/Time.
Column Settings
Each column within the Medications grid has menu options to Pin Column, Autosize, and Reset Columns. Click on the Menu icon to view the drop-down listing. After making column setting selections, click on the button to retain column settings for future coding sessions.
| Column Setting | Definition |
|---|
| Pin Column | Allows users to select the column and then pin it to the RIGHT or LEFT side of the assigned accounts grid. This function works similarly to freezing columns in Excel. |
| Autosize This Column | Select this option to change the column width to automatically size the width of the column for contents of the cells in this column. |
| Autosize All Columns | To quickly autosize all columns in the assigned accounts grid, click the Autosize All Columns button. |
| Reset Columns | Click on this option to Reset Columns to their default column width. |
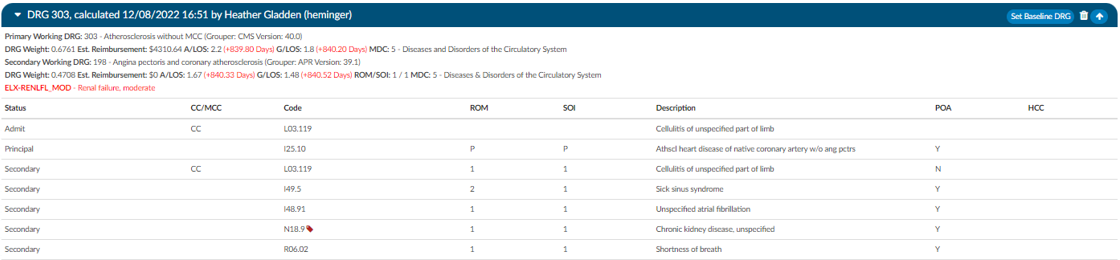
Working CDI History
The working CDI History can be used to look at historical working DRG calculations. The Coders cannot edit this information, but they can review the data.
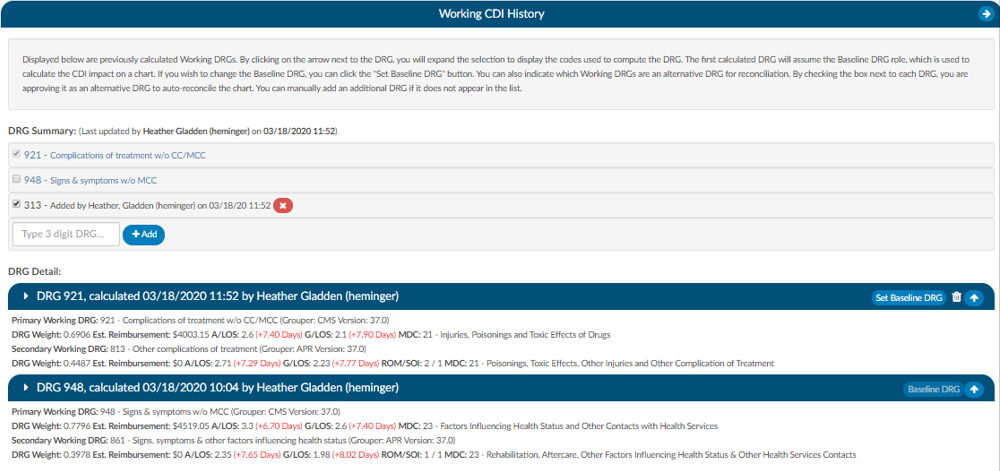
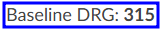
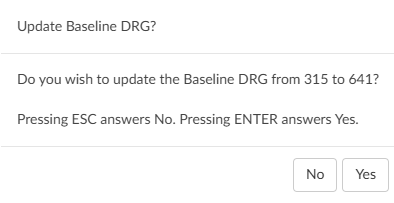
The first calculated DRG will assume the Baseline DRG role, which is used to calculate the CDI impact on a chart. Users wishing to change the Baseline DRG, can click the Set Baseline DRG button.
Users can also indicate which Working DRGs are an alternative DRG for reconciliation. By checking the box next to each DRG, users are approving it as an alternative DRG to auto-reconcile the chart. Users can manually add an additional DRG if it does not appear in the list.
Clicking on the arrow prior to the DRG information will expand the selection to display the codes that went into the DRG and the sequence. Any codes with a plus sign indicates the code has not been added to the account. The plus sign does not indicate that the codes need to be added. It simply allows the user to quickly add the code if they have determined it is vaild using their coding judgment and supporting documentation. If applicable, the code’s HCC designation will show the HCC number and its version.
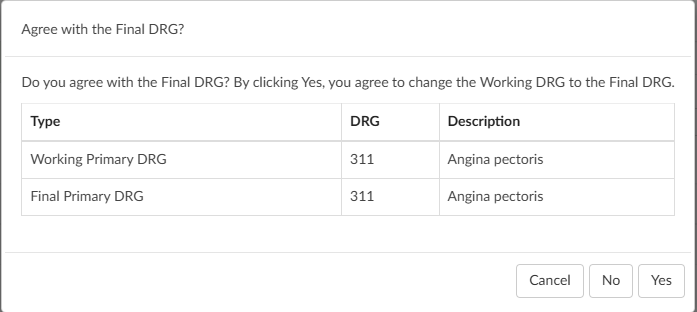
DRG Reconciliation
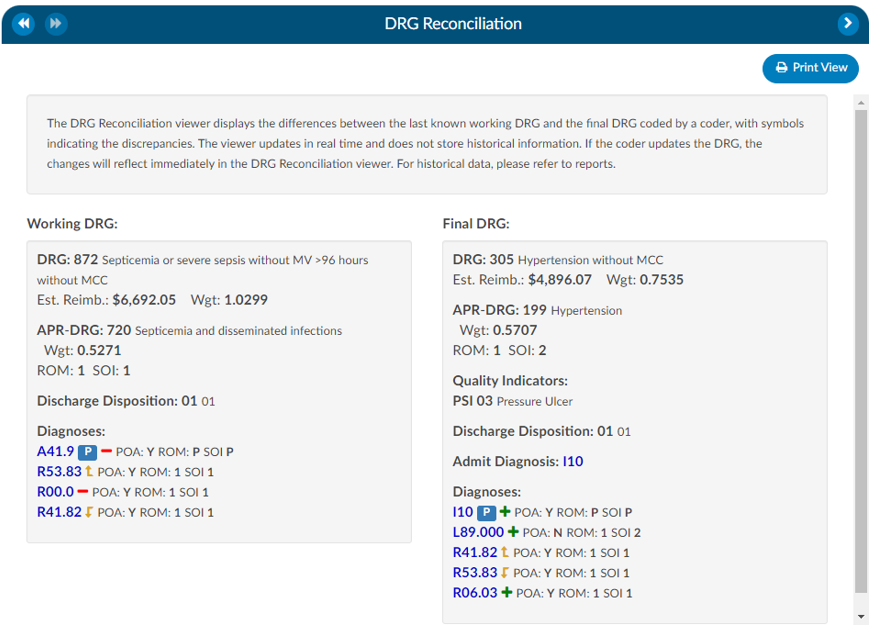
The DRG Reconciliation viewer displays the differences between the last known Working DRG and the Final DRG coded by a Coder, with symbols indicating the discrepancies. The viewer updates in real time and does not store historical information. If the Coder updates the DRG, the changes will reflect immediately in the DRG Reconciliation viewer. For historical data, please refer to reports.
Impact Queries
The Impact Queries Viewer is designed exclusively for CDI teams. This tool may not be necessary for all customers, but it serves a specific purpose for those who use it. CDI teams often issue multiple queries per account and require a way to track the impact of each query distinctly. This viewer allows teams to determine whether the impact of a query accounts for the total change in the account or if it shares this impact with other queries.
Purpose and Use
- Impact Tracking: Allows CDI specialists to clearly see the account impact of each query, from the initial baseline to the final assessment after all queries.
- Impact Assignment: Within each query, CDI specialists can assign a percentage to quantify the impact of the query on the account. This percentage is then translated into a dollar value attributed to the query.
This feature helps prevent double-counting and overestimating the impact that CDI claims on an account. After coding is completed, CDI specialists must revisit and reassess the account to determine and specify the precise impact each query had.
By using the Impact Queries Viewer, CDI teams can ensure more accurate and accountable query impact assessments, contributing to more precise documentation and reimbursement processes.
To access the Impact Queries Viewer, the user must have a CDI role AND there must be at least one (1) query sent by a CDI user.
Displayed at the top of the viewer is the Baseline, Working and Final DRG. The account impact equals Final DRG – Baseline DRG.
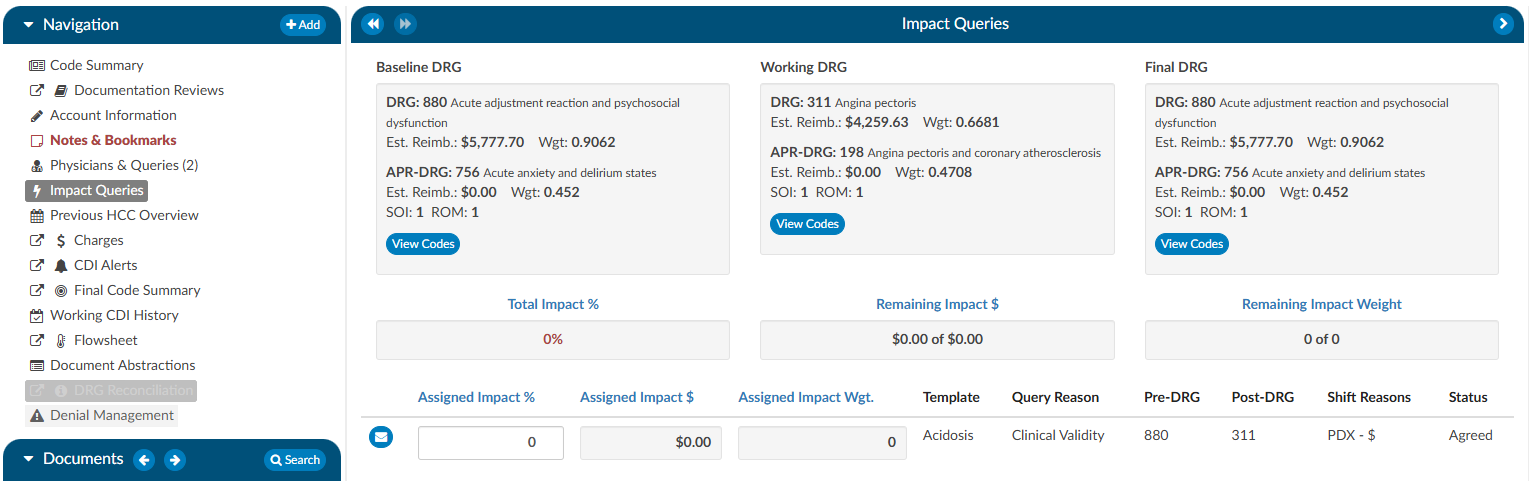
Clicking on the View Codes button in either the Baseline or Working DRG boxes will take the user to the Working CDI History viewer to allow the user to view how the CDS developed their DRG at different stages. Clicking on the View Codes button in the Final DRG box will take the user to the Final Code Summary viewer to show the user how the account was final coded by the Coder.
To review the query that was assigned, click on the BLUE ENVELOPE
. This will open the query in a dialouge box.
To assign the impact of the query, the user will enter a percentage in the “Assigned Impact %” field. This will autocalculate the following fileds:
- Total Impact %
- Remaining Impact $
- Remaining Impact Weight
- Assigned Impact &
- Assigned Impact Wgt.
| Field | Definition |
|---|
| Total Impact % | This the % of the impact assigned to queries it can never exceed 100% but, it is allowed to be less than 100%. The impact % must be assigned in the assigned impact % field per each query. |
| Remaining Impact $ | This is the account impact dollars left to divy out. Think about this like a bank account if the account impact between the baseline and final DRG is $10,000 it should start off with $10,000 then if we assign 50% of the account impact to the first query then it would reduce to $5k and so on. |
| Remaining Impact Weight | This is the same concept as Remaining Impact $ we have a field for Remaining impact weight since some sites do not have reimbursement dollars in the system. |
| Assigned Impact % | This is the % of the account impact you are assigning per query. |
| Assigned Impact $ | This is the $ of the account impact you are assigning per query based upon the % you placed in the assigned impact % field that pulls from the remaining impact $. |
| Assigned Impact Wgt. | This is the weight of the account impact you are assigning per query based upon the % you placed in the assigned impact % field that pulls from the remaining impact weight. |
| Template | This is the query template you are assigning impact to. Only queries issues by CDI will display here. |
| Query Reason | This is the query reason to assigned to the query template. |
| Pre-Drg | This is the pre-DRG assigned to the query, to change this click on the blue envelop icon to the right of assigned impact. |
| Post-Drg | This is the post-DRG assigned to the query, to change this click on the blue envelop icon to the right of assigned impact. |
| Shift Reasons | This is the shift reasons assigned to the query, to change this click on the blue envelop icon to the right of assigned impact. |
| Status | This is the status of the query, to change this click on the blue envelop icon to the right of assigned impact. |
Impact Assignment
For guidelines on how to quantify the impact of a query, or queries, contact your supervisor for any internal policies and procedures.
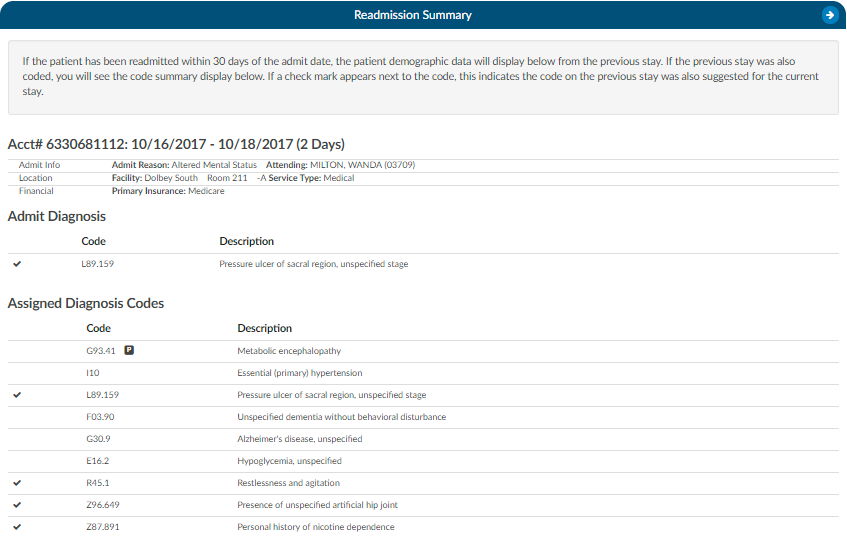
Readmission Viewer
If the patient has been readmitted within 30 days of an admission date, the patient demographic data will display below from the previous stay. This is not just for inpatient readmissions, but also includes if the patient was ever seen for any patient type within the last 30 days. The 30 days look back can also be expanded to 45 or 90 days. If the previous stay was also coded, you will see the Code Summary display below. If a check mark appears next to the code, this indicates the code on the previous stay was also suggested for the current stay.
If an account has multiple re-admissions, they will all show if they are in the default time of 30 days. A setting can be changed to allow the number of days to be customized. If the setting is updated to an amount other than 30, that new amount will show in the Re-admission Viewer AND in the red tag in the banner. Please contact Support (cacsupport@dolbey.com) to have the setting configured, if desired.
Denial Management
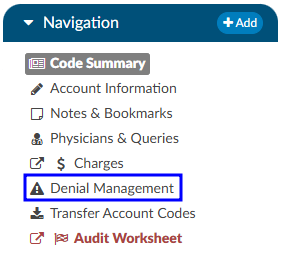
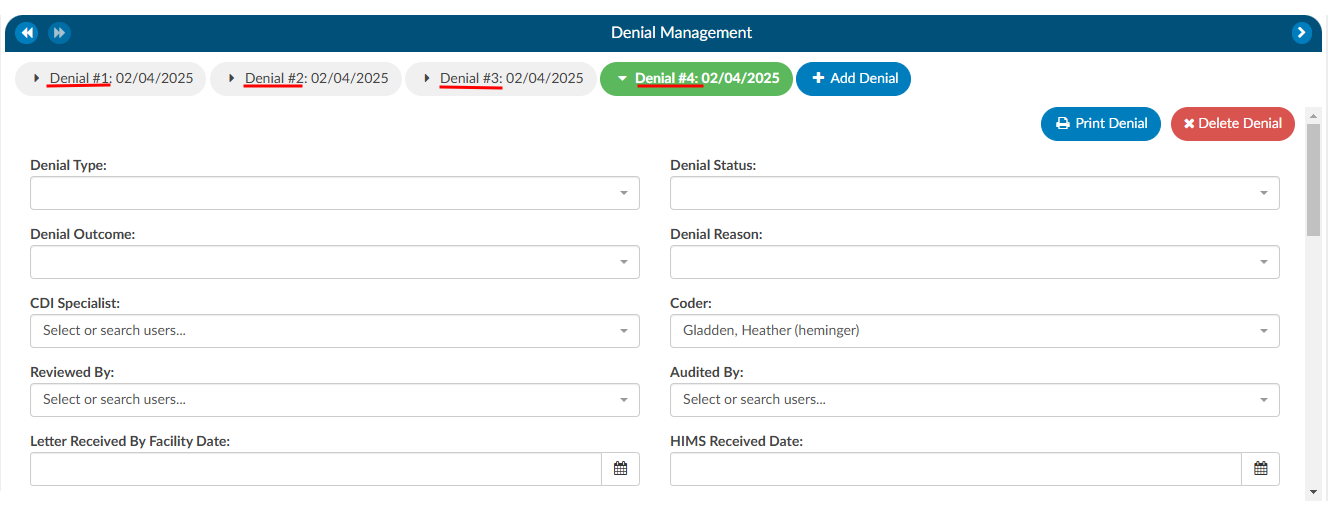
The denial management viewer displays on submitted accounts. Clicking on this viewer presents a form with several fields to be filled in when an account has been denied payment.
Denial management tracking involves monitoring cases where a patient’s submitted billing chart is rejected by the payer. Various reasons, such as medical necessity, code, or DRG assignment, could lead to these denials. This tool is designed to comprehensively record the specifics related to denial management and tracking. It is capable of documenting multiple denials for each chart, with the ability to log and categorize them for the purpose of tracking, managing workflows, and generating reports.
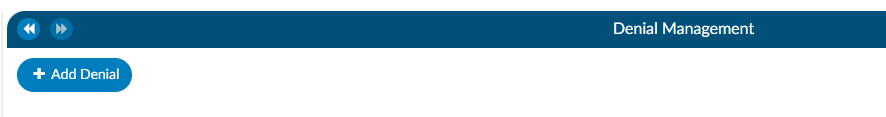
Adding a Denial
To add a denial, select “Denial Management” in the Navigation tree. This option will only be available if the account has been submitted. This will open up the Denial Management viewer in the center of the screen to then click on the +Add Denial button.
Once a denial has been added, a form with multiple fileds will need to be filled in by the user working the denial. The fields are made up of various drop-down options, dates, and financial information about the denial.
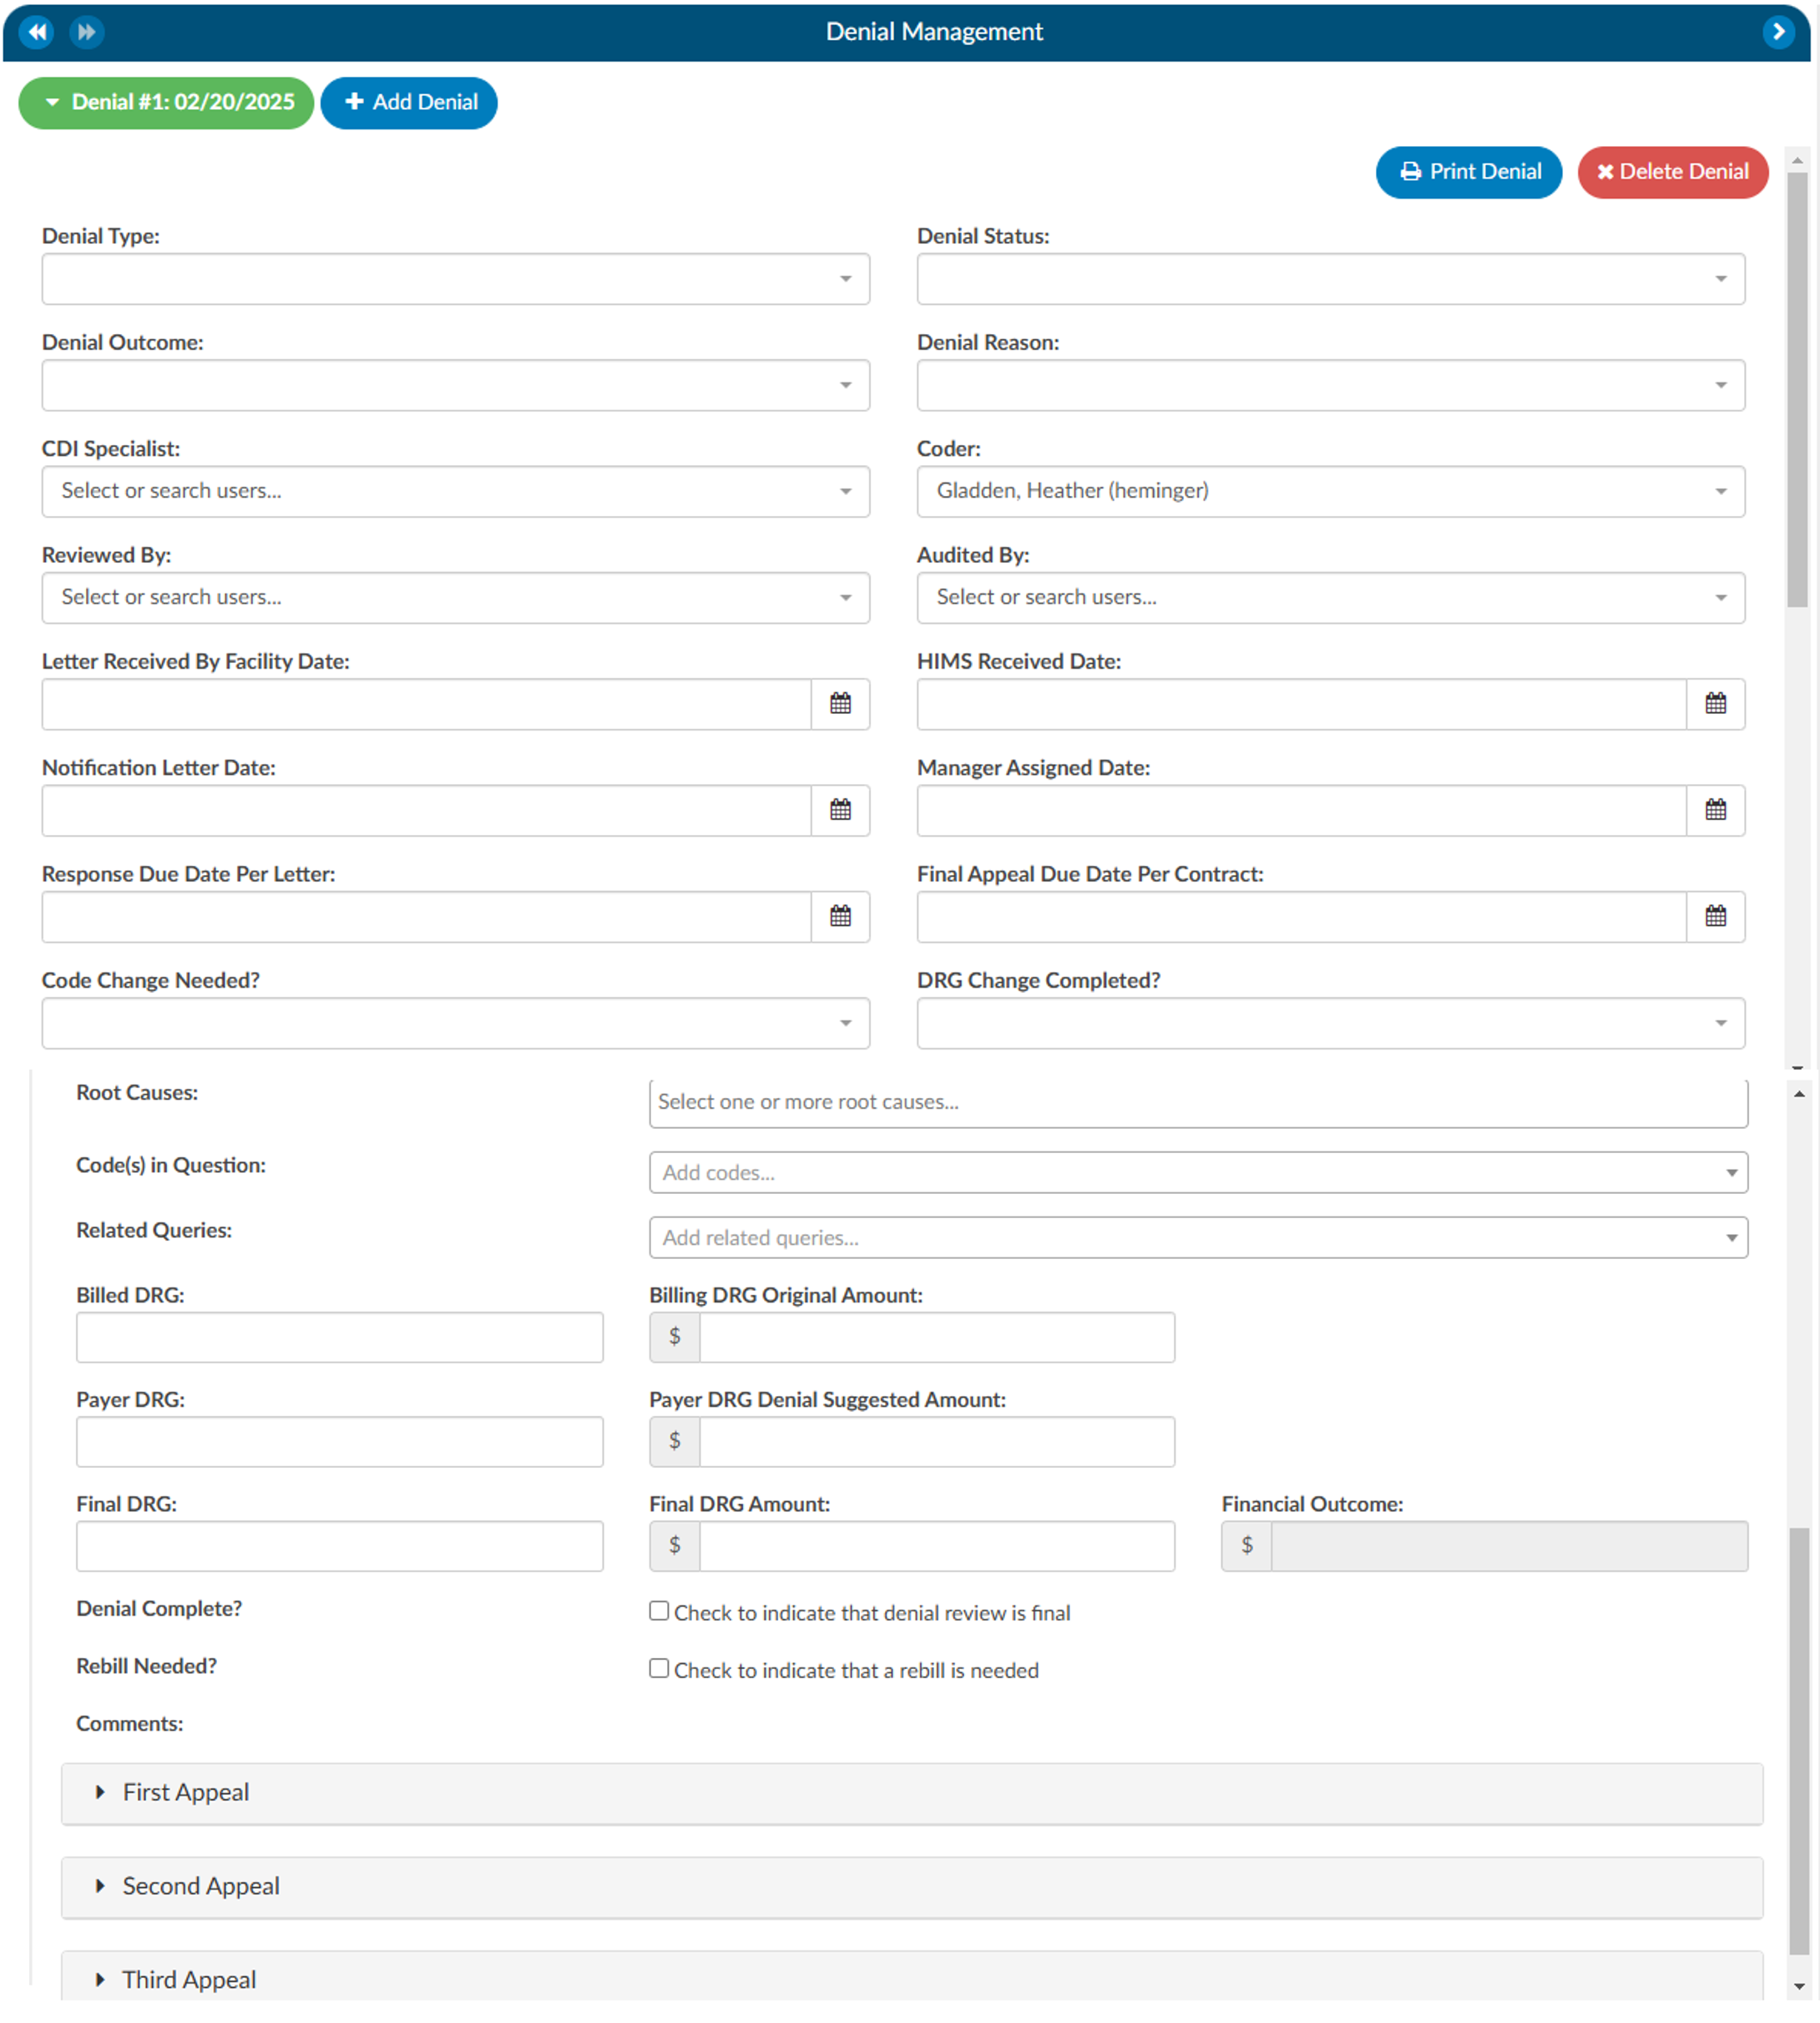
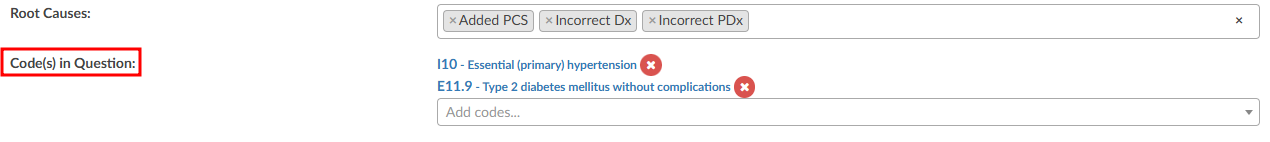
The Root Cause field has a drop down of options where one or more options can be selected.

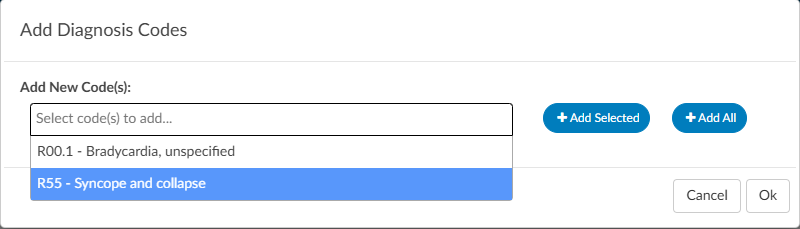
There can also be multiple Code(s) in Question entered.
Options in the fields above with dropdown lists can be customized per organization by editing the appropriate mapping table in Mapping Configuration. These fields include the following:
- DenialType
- DenialStatus
- DenialOutcome
- DenialAppealRoute
- DenialReason
- DenialCodeChangeNeeded
- DenialDRGChangeNeeded
- DenialRootCauses
Each field (except Comments) can be added to Grid Column Configuration for display in Account Search. These fields can also be used in workflow if necessary.
As needed, mutiple denial sheets can be created for a single account. To do this, click on the +Add Denial button. As more denials are added to an account, they will be listed at the top of the Denial Management viewer. The denial a user is working on will be indicated in green bubble.
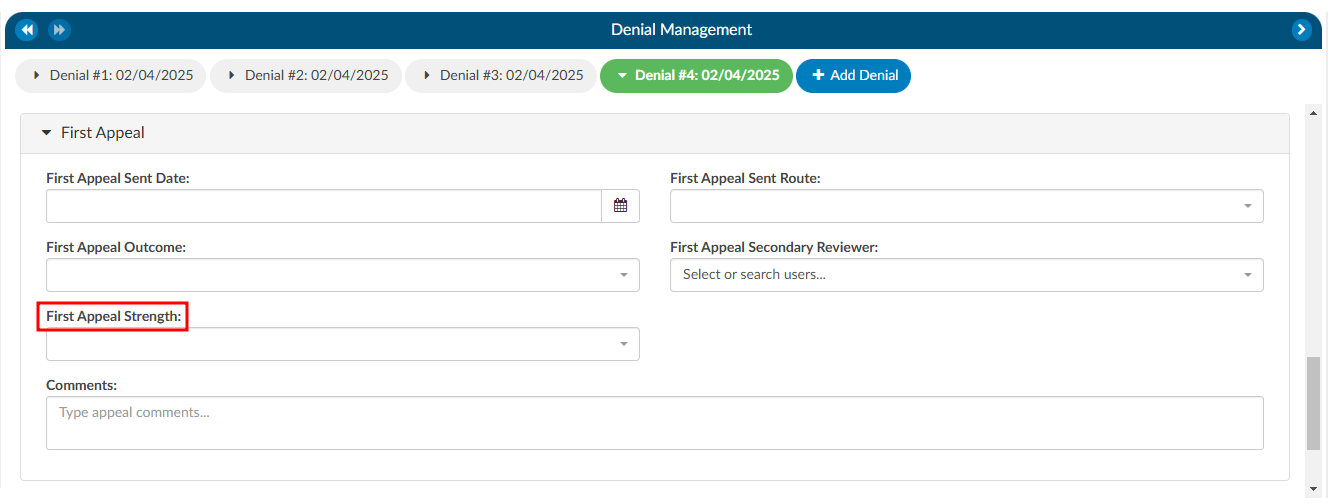
Appealing a Denial
If a denial needs to be appealed, there are separate fileds to track when those appeals were sent, how it was sent, and the outcome of the appeal. A user can track the strength of the appeal as low, medium, and high based on their organizations preferences. Additionally, a comment section has been added for any free text the user would like to enter.
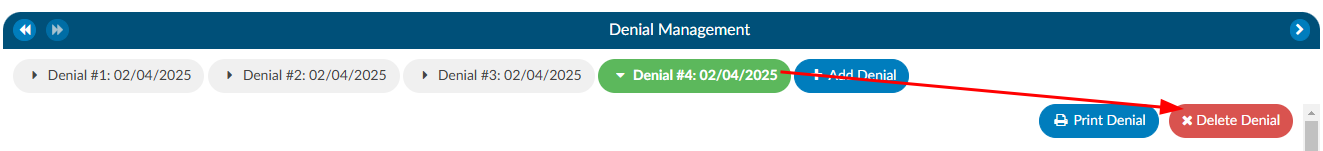
Deleting a Denial
If a denial needs to be deleted from the account, click on the denial the user wishes to remove, which will bee in the green bubble, then click on the xDelete Denial button.
Reporting Denials
For reporting within Account Search, a Denials drilldown is available. This drilldown only reports on the first denial on the account.
Documentation Reviews
The Documentation Review module is designed to provide flexibility for sites that prefer a different style of Clinical Documentation Improvement (CDI) reviews or need alternative methods for tracking management reporting. This module allows users to customize and monitor documentation reviews by various topics and types. It is particularly useful when reviews do not fit the conventional workflows of initial, follow-up, or reconciliation reviews, such as for utilization management purposes.
Why Use Documentation Review?
Sites sometimes choose to add documentation reviews because reporting productivity is more complex than tracking initial, follow-up, or reconciliation reviews. The module’s flexibility allows CDI teams to capture and track additional review types that are essential for comprehensive reporting but might not fit within the standard review categories.
Standard Review Definitions
Before exploring the customization capabilities of the Documentation Review module, it is essential to understand the baseline definitions of reviews in a CDI system:
Review: A review is defined as a save on an account by a CDI Specialist (CDS) on a single day. For inpatient accounts, the specialist must also calculate a Working DRG. Multiple saves on the same account by the same CDS within the same day count as one (1) review. In other words, there can be only one review per account per CDS per day.
Initial Review: The first review saved on an account by a CDs. For inpatient accounts, the CDS must calculate a Working DRG for it to count as an initial review. There can only be one initial review per account.
Follow-up Review: A review saved on an account by either the same or a different CDS on a different day, following the initial review. No account will have more than one follow-up review per day for the same CDSS.
Example:
Day 1: CDI Specialist “A” saves an inpatient account with a Working DRG.
Day 1: CDI Specialist “A” updates the Working DRG (does not count as a separate review since it is within the same day).
Day 2: CDI Specialist “B” saves the account with the same Working DRG (counts as a follow-up review).
Day 3: CDI Specialist “A” saves the account with the same Working DRG.
Day 3: CDI Specialist “B” saves the account with a different Working DRG (counts as a follow-up review).
In this scenario, there is one initial review and three follow-up reviews. The change made by CDI Specialist “A” on Day 1 does not count as a follow-up because it occurred on the same day as the initial review.
Customizing Documentation Reviews
By default, the Documentation Review module includes a free-form text field, allowing CDI specialists to capture detailed information about their reviews. However, sites can further customize the module by creating forms specific to different review types, enabling more structured and consistent data entry.
Using the Worksheet Designer, sites can create tailored forms for different documentation review types. These forms can help standardize data collection and improve reporting accuracy. Some common examples of custom review types include:
- MD Advisor Response
- Query Opportunity Reply
- Coder Question Response
- Post-Discharge Follow-up
- Pre-Bill Review
- Retrospective Query Needed
- Query Review
- Case Management Review
- Quality Improvement (QI) Review
- Utilization Review
- Types of Reviews
Custom reviews allow CDI teams to track reviews that fall outside of traditional CDI workflows. These reviews can be particularly useful for:
- Post-Discharge and Pre-Bill Reviews: These reviews focus on ensuring documentation accuracy and completeness before the billing process, helping to reduce denials and optimize revenue capture.
- Query and Retrospective Reviews: These reviews allow CDI teams to capture follow-up actions taken after initial queries or when additional queries are required after discharge outside of a traditional review.
- Utilization Management Reviews: These reviews may not fit into the standard initial or follow-up workflows but are crucial for tracking how effectively hospital resources are used and ensuring proper reimbursement.
- Reporting and Productivity: Tracking productivity for non-standard reviews (such as utilization reviews or post-discharge follow-ups) can be more complex than traditional reviews. Customizing the module allows sites to generate more meaningful reports that reflect the variety of documentation efforts made by CDI teams.
In the CDI Summary section of the dashboard, counts of reviews are displayed, such as “In the Last 7 Days,” excluding the current day. This allows for real-time tracking of CDI efforts and helps managers assess team productivity.
CDI Productivity by Review Type
This report shows productivity by each user by custom documentation review type.
CDI Detailed by Review
This report provides details about the custom documentation review type of CDI reviews performed by account.
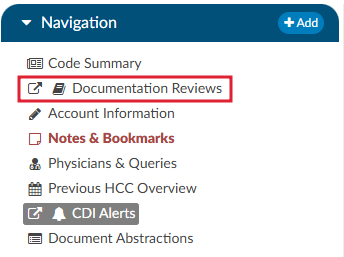
Navigating to Documentation Review
Unlike the CDI Worksheet which is located under the Document tree, the Documentation Review section is found on the Navigation tree within the user interface. This distinction allows easy access to reviews that are separate from the standard CDI workflows and documents.
Steps to Access Documentation Review
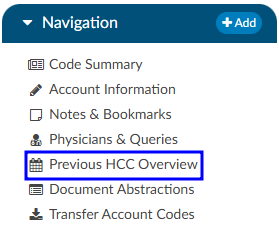
- Locate the Navigation tree: Once logged into the system, navigate to the left-hand side of the screen where the Navigation tree is displayed.
- Select Documentation Reviews: Under the Navigation tree, will be the Documentation Reviews section. Click on it to open the review interface.
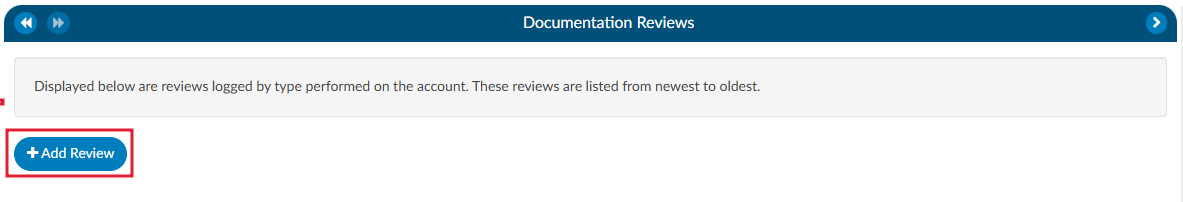
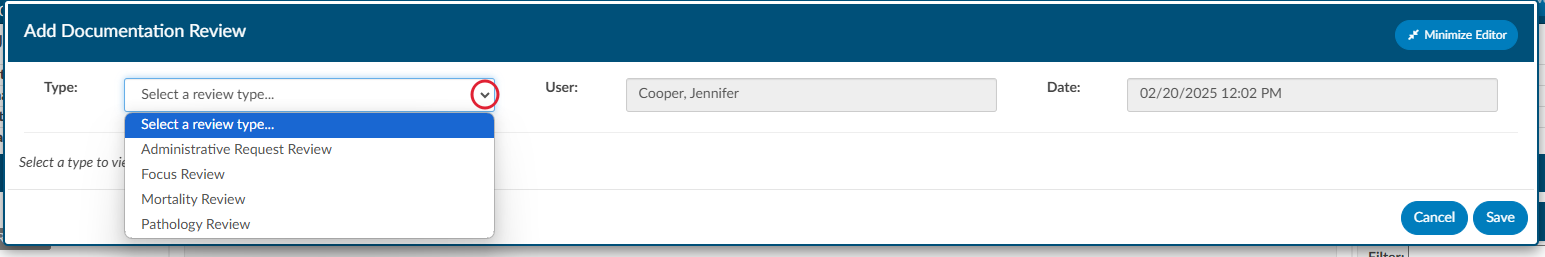
- Adding a New Review: Upon opening the Documentation Reviews viewer, you will have the option to +Add Review. This allows the user to select the specific review type from the list of available choices. The choices available are customized per organization and can include any form types an organization has designed.
Previous HCC
The Previous HCC Overview will display the HCC history to show for both the current and prior year. When HCCs are enabled, these will display grouped by HCC category and by code — showing the account number and MRN for the visits each were associated to.
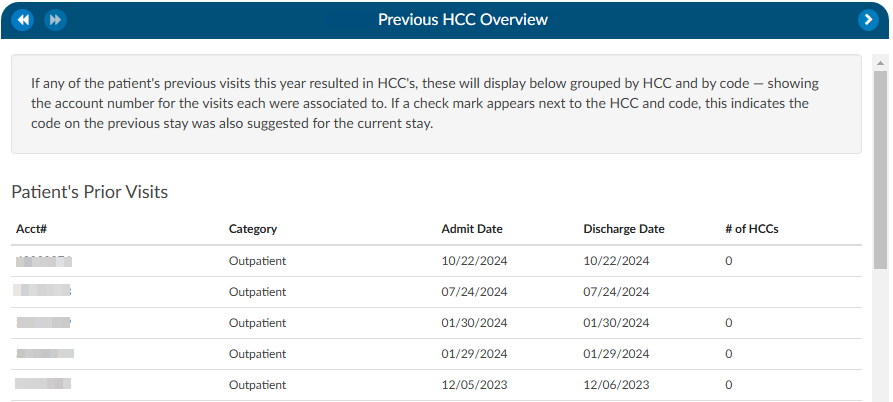
If a check mark appears next to the HCC category and code, this indicates the code on the previous stay was also suggested for the current stay. If the patient chart currently being coded has codes that result in HCCs once they are added to the assigned code tree the code will display with an ‘H’ next to the code. By hovering over the ‘H’ icon, the HCC category will display.
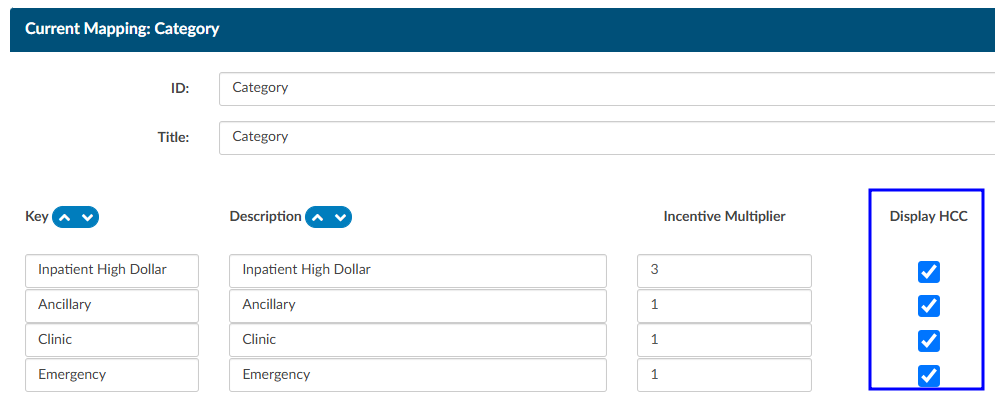
It is recommended to turn HCCs on for all patient types to capture a more complete picture of HCCs. HCCs will be collected once HCCs have been enabled in the mapping table. To enable HCCs, check the box in the Category mapping table.
As a reminder, this will not capture data prior to turning this feature on in the mapping table.
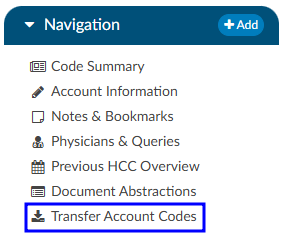
Transfer Account Codes
Transfer codes can be used to help combine account codes into one encounter. Most sites leverage the ADT to combine the actual account; however, there are times it is necessary to copy codes from one encounter to another.
If a patient has two different accounts and the coder has already done work on each of the accounts, the Transfer Codes feature can be an easy way to post codes when you’re within one account and want to search in another account, and have the ability to open that other account and see the codes.
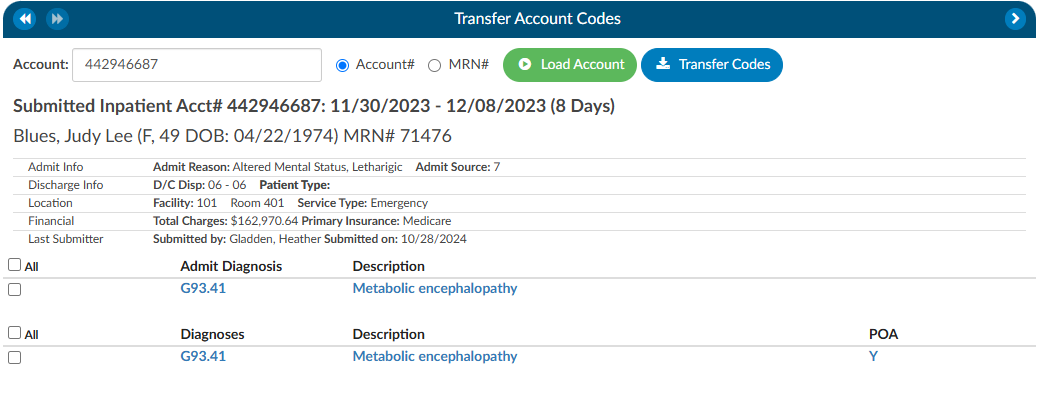
To transfer codes either select the Account# radio button and type in the account number, or select the MRN radio button where the MRN of the opened account will populate. Once either of those numbers are entered, click the Load Account button. When the account or MRN is loaded, use the check boxes to the left of the codes to choose which codes will transfer. Once the needed codes are checked, click on the Transfer Codes button and the codes you selected will be added to the “Assigned” codes tree that is on the current account.
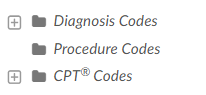
Add-On Modules and Viewers
Optional Viewers
The following viewers are part of optional
add-on modules
and may not be used at all organizations. If you are unsure if a module is relevant to your
organization, please contact your supervisor. Organizations looking for more information on
these modules should reach out to the Dolbey SME team via email (smeteam@dolbey.com).
Audit Module
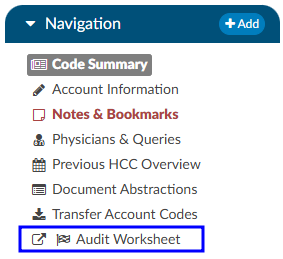
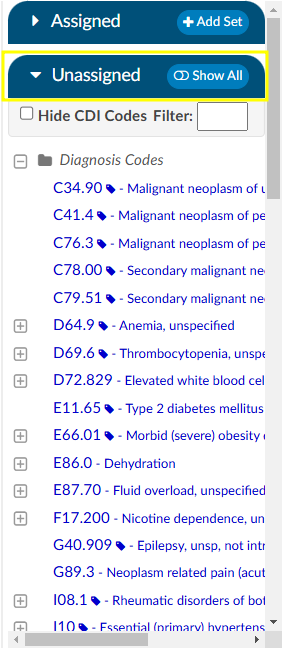
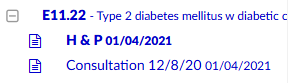
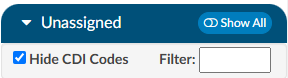
The audit viewer displays when the account is opened by a user in the role of Auditor. The audit viewer can be popped out onto a separate screen, allowing the auditor to have a screen for reviewing the chart. By selecting “Show All” codes in the unassigned code tree, the auditor is taken to the documents/documentation supporting that code. This will help streamline the audit process.
An account can have one or more audits added to it. By clicking +Add Audit a new, blank audit worksheet will be created. These worksheets are numbered and displayed at the top of the audit viewer, along with a date stamp indicating when each worksheet was opened. The worksheet currently being viewed will be highlighted with a green background.
Data in the audit viewer is only intended for coder education and administrative staff to score how the coder is doing in a report card. The auditor will need to add the coder of record so that the coder of record, any auditor, or other user role that has been given access can view the audit worksheets.
The audit module allows for the role of an auditor within the application. The role of an “Auditor” has the same privileges as a “Coder” when it comes to account editing. More details on audit functionality can be found in the Audit User Guide.
Discrete Values (Viewer)
This feature may not be supported by your organization’s EHR vendor. The Discrete Values viewer show trending data or data that has values. The most common examples of discrete values are lab values and vital signs. The viewer can be popped out into another window by clicking on a little square with an arrow pointing to the right in the navigation tree next to the viewer name.
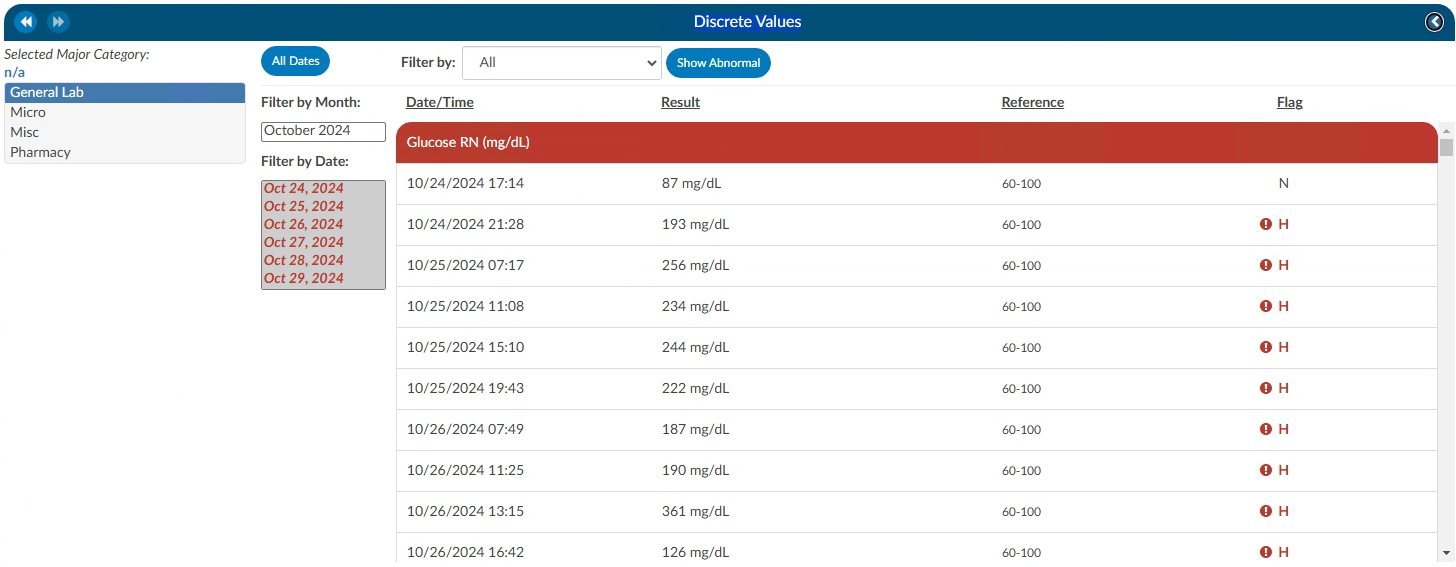
An older style of discrete data can be displayed in a Discrete Values viewer. Tabs across the top of the screen display the categories of data. This displays each of the types of discrete data elements, which may vary by organization.
The Discrete Values viewer has a Filter by Month box, listing the months that contain values. Selecting a month will highlight all the corresponding dates in the Filter by Date box. The resulting values will show in the viewing pane. The Normal and Abnormal tabs both have this functionality and are filtered separately.
Discrete Values with a grey header are within normal limits. Each organization sends what is the reference point to determine what is normal and what is abnormal. If a header is display in red, it is considered abnormal by the organization. In addition to the header color, users can tell if the value is out of normal limits as there is a flag that indicates if the value is low vs. high.
Flowsheet (Viewer)
This feature may not be supported by your organization’s EHR vendor. The Flowsheet viewer shows information found in nursing documentation such as nursing or respiratory assessments, skin assessments, intake and outake data, etc. The viewer can be popped out into another window by clicking on a little square with an arrow pointing to the right in the navigation tree next to the viewer name.
The Flowsheet viewer is the most recent style of discrete data viewer. This viewer is organized much like a spreadsheet. Depending on configuration, users may see major categories on the left-hand side of the spreadsheet (there are many different options as each site is a little different.). Upon clicking on one of these items users will be presented with a grid to the right. That grid will have multiple columns, the first column being name. Hovering over the column name will display three little lines. Clicking on them, will allow the user to filter in order to narrow down the data. If any of those names appear in red that means that at least one of the data elements are outside of the normal limits if there is a range.
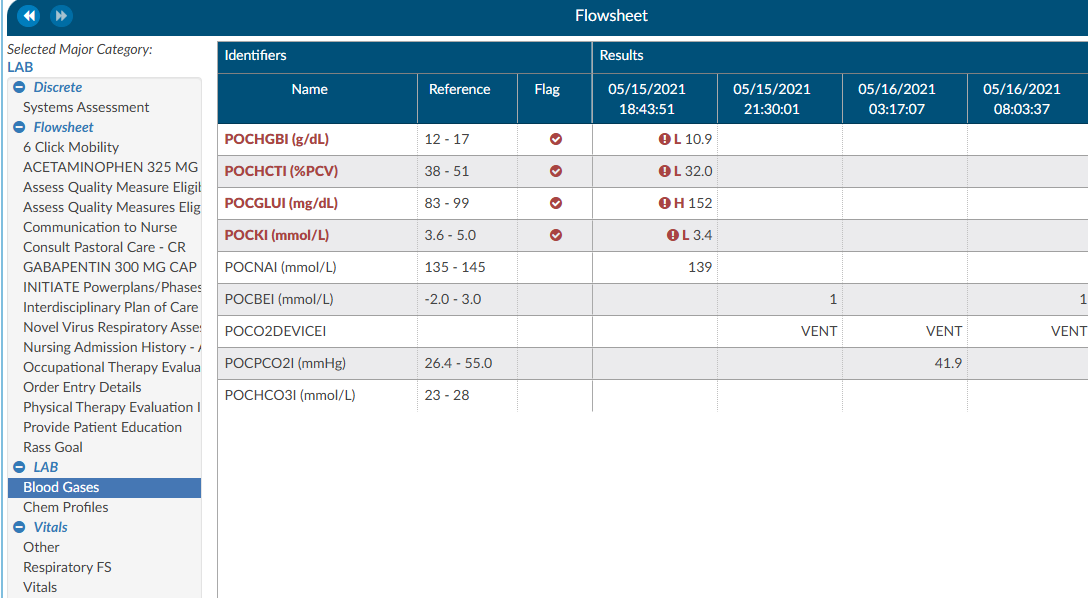
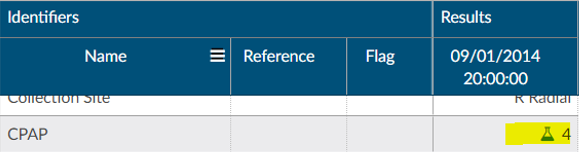
To the right of the name, if applicable, is a reference column. This reference column will indicate if the value is within normal limits. This is data that the EHR system has sent to Fusion CAC. If the reference column is available, then to the right of that is a flag column. A checkmark in that field also means the value is out of the normal range. This column can also be filtered if the user wants to look at everything outside of the normal limits. Next to that field is a date and time column. The user may see multiple dates and times depending on how the data is organized and how frequently it is documented. If a discrete value on the Flowsheet viewer has a specimen, it will show as a beaker symbol in the Results column. Hovering over the symbol will provide the name and site of the specimen.
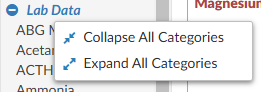
Right clicking in the Major Category column will show a menu allowing the user to expand or collapse all categories. That configuration will be saved for all accounts that have the Flowsheet Viewer, per user role. Note that if a user collapses/uncollapses a major category in the pop-out, it will not be seen on the main page until the user moves to a different viewer and back.
ER E/M Module
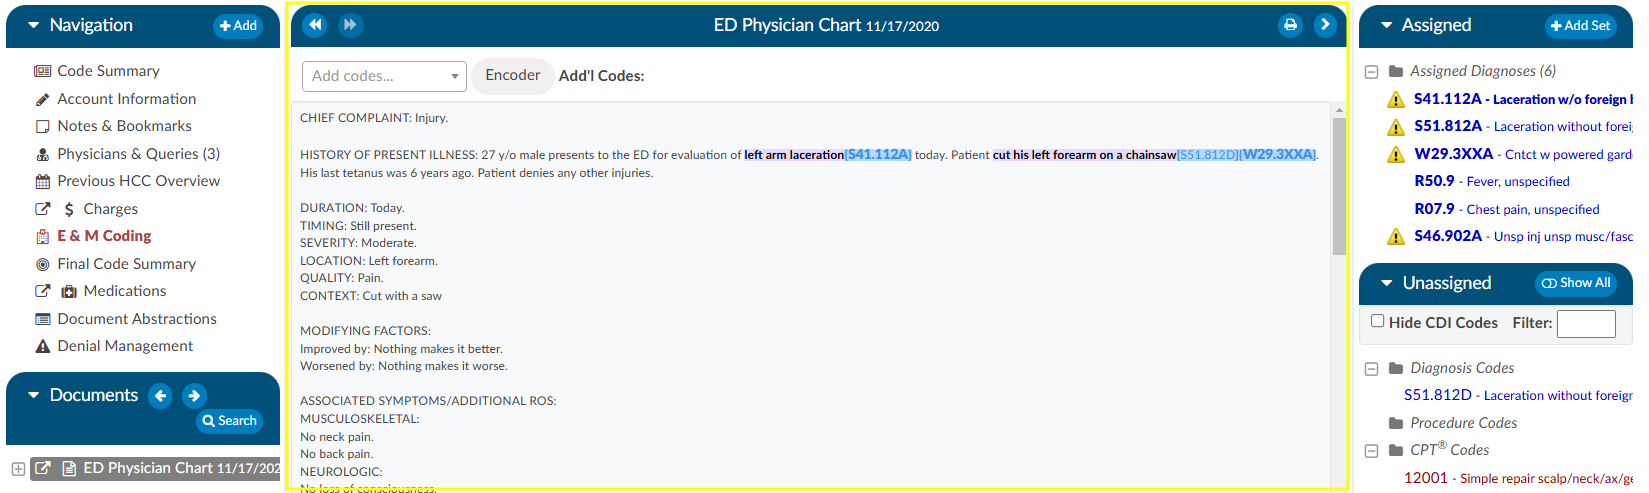
The ER E/M viewer is part of an add-on module for any chart with a “Is Emergency” flag within the account properties.
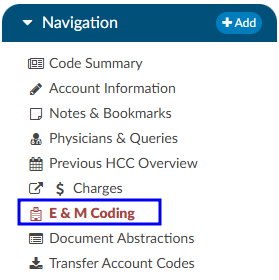
If this module is turned on, any “Is Emergency” chart will have the “E/M Coding Worksheet” in the Navigation menu.
There are several sections to the E/M Coding worksheet including: E/M No Charge, E/M Level, Trauma, Critical Care, Medications, and Additional Charging. More details on ER E/M functionality can be found in the Administrative User Guide.
Completing the ER E/M Worksheet
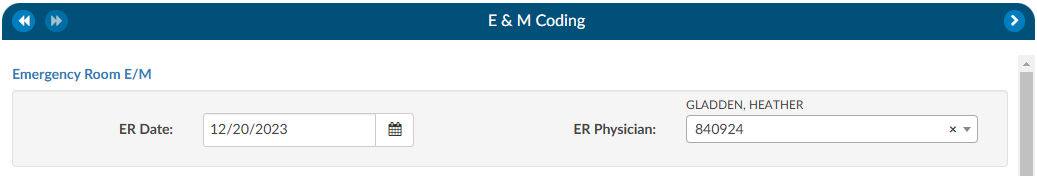
ER Date and Provider
The first step in completing this worksheet is filling in the ER Date and the ER Physician fields. Once these are completed, the rest of the worksheet will populate.
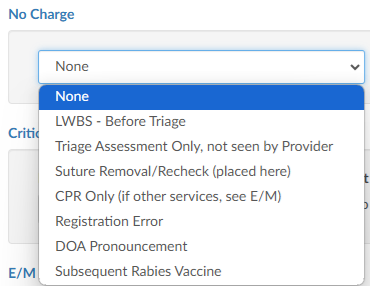
No Charge
If a patient fits the criteria for “no charges” (for example, a registration error), all other fields in the worksheet go away because there is nothing else to be done from an ER charging perspective. However, other selections from the list will populate the fields accordingly.
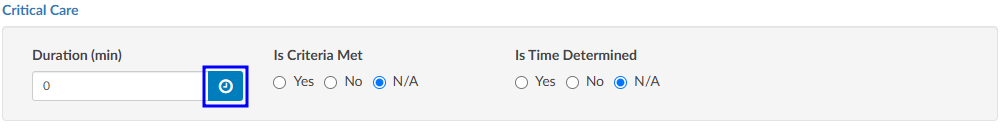
Critical Care
Select appropriate answers to “Is Criteria Met” and “Is Time Determined.” To enter the duration, click on the clock icon.
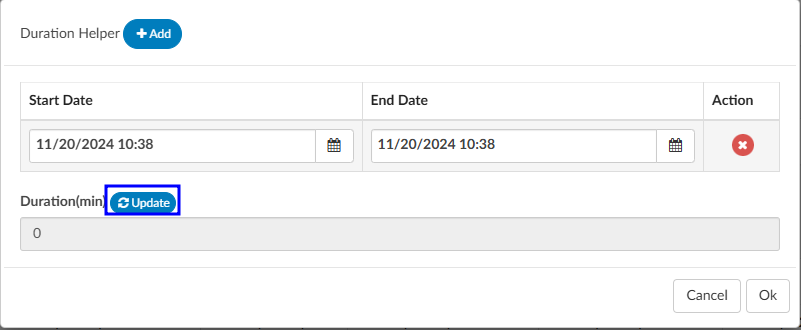
Enter start date/time and click on the Update button for the minutes to display.
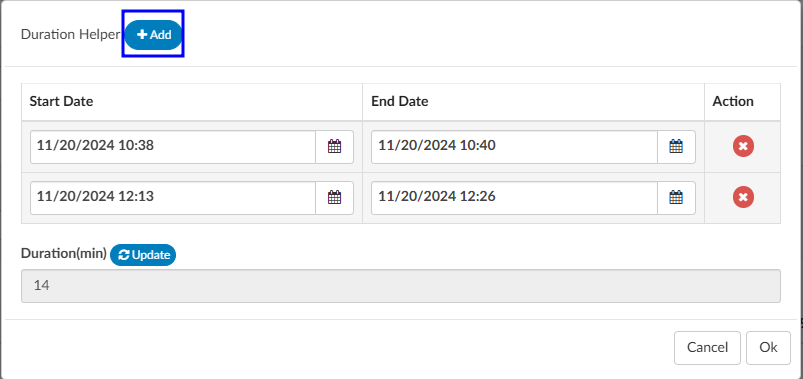
If there were multiple spans of time for critical care, click on +Add and enter any additional durations of time. The system will add up on the minutes and display once “Update” has been selected.
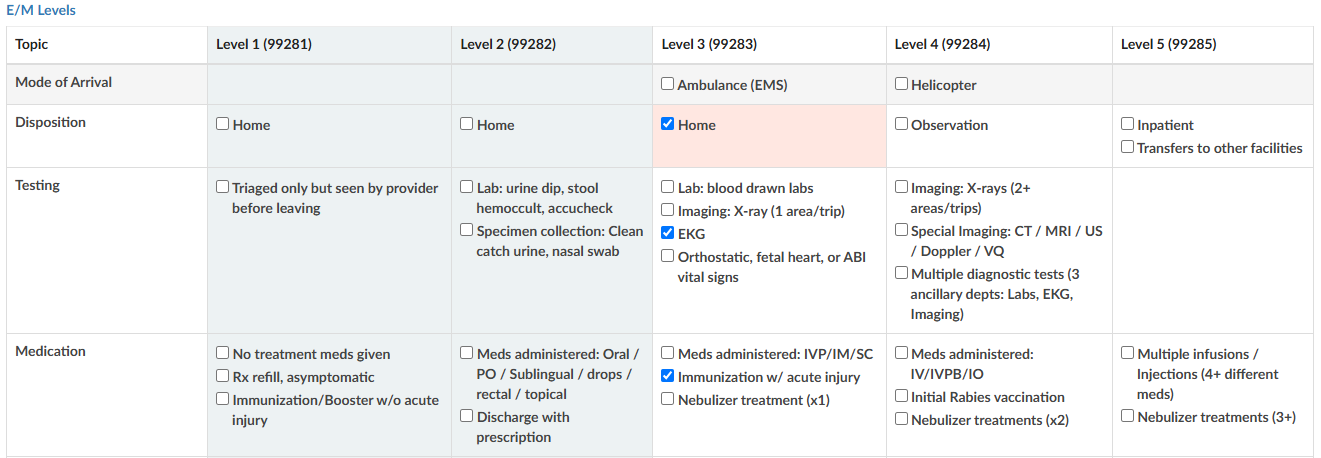
E/M Levels Matrix
The E/M Levels martix is configured per organization. This matirx will allow the user to check what interventions were completed during the ER visit. Once an intervention is selected from one of the columns, that becomes the minimal level and all columns before that will gray out. As the remaining sections are completed, users may see the level advance.
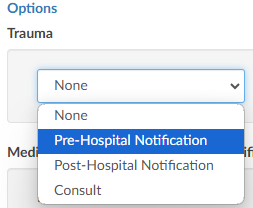
Trauma
If the case was a trauma, make the appropriate selection from the dropdown menu (pre-hospital notification, post-hospital notification, consult).
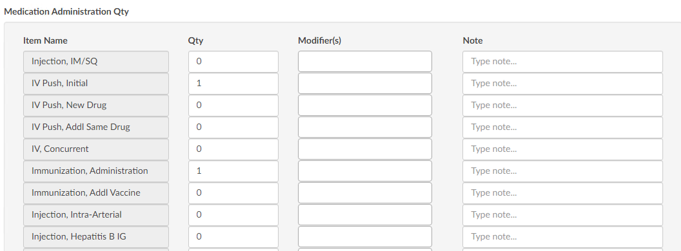
Medication Administration Qty
Based on the selection, additional fields or boxes will populate. Complete the quantities, add modifiers, and any notes. Modifier fields are available in the appropriate sections of the worksheet. The user can add up to four (4) modifiers unless they are using the Solventum CRS encoder, then they will be able to add up to five (5) modifiers. The “Notes” field is available for the coder to track things such as medications.
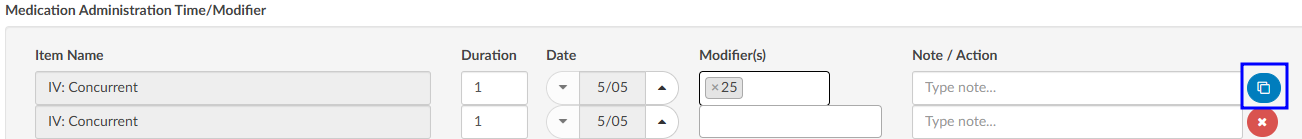
Medication Administration Time/Modifier
Update this section with the duration of each medication as needed, any modifier(s), and notes. The user can add up to four (4) modifiers unless they are using the Solventum CRS encoder, then they will be able to add up to five (5) modifiers.
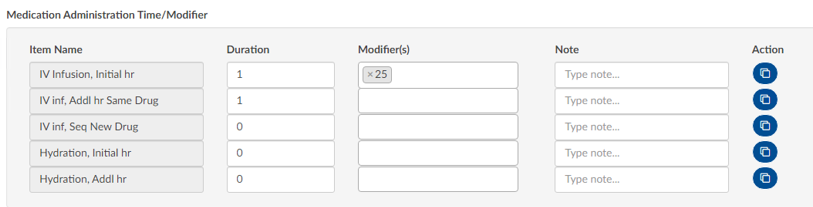
If there are multiple infusions (for example, one infusion started in left arm and one infusion stated in the right arm), click on the Action button to create another row to be completed including appropriate modifiers for each infusion.
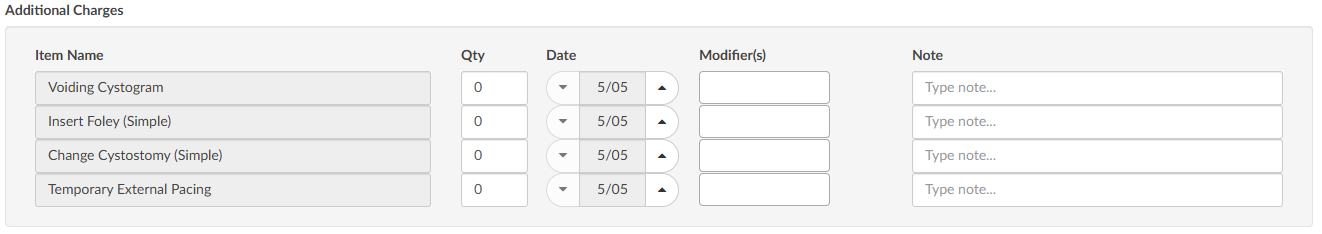
Additional Charges
Add any additional charges. Much like the matrix, the additional charges section will be configured per each organization to include the necessary charges each organization captures.
Charges for Assigned CPT Codes
If the Coder adds a CPT code (otherwise referred to as “soft code”), the codes will appear in this section of the E/M Coding worksheet. It must then be determined by the Coder, or Charger, if the procedure added by the Coder occurred in the ER and should be charged. If so, the fields should be completed. If the procedure is determined to have occurred elsewhere, leave the 0 in the field.
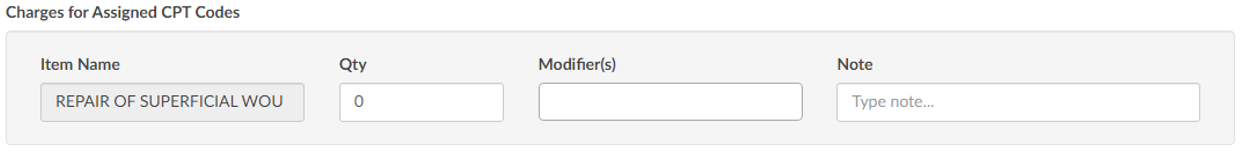
Note
When there is a CPT coded added that has no CDM charge, it won’t appear in this section; only those that have a CDM.
E/M Summary
Once the Additional Charges section is complete, users will see the Summary which details the E/M level and other charges with the corresponding CDM Code.
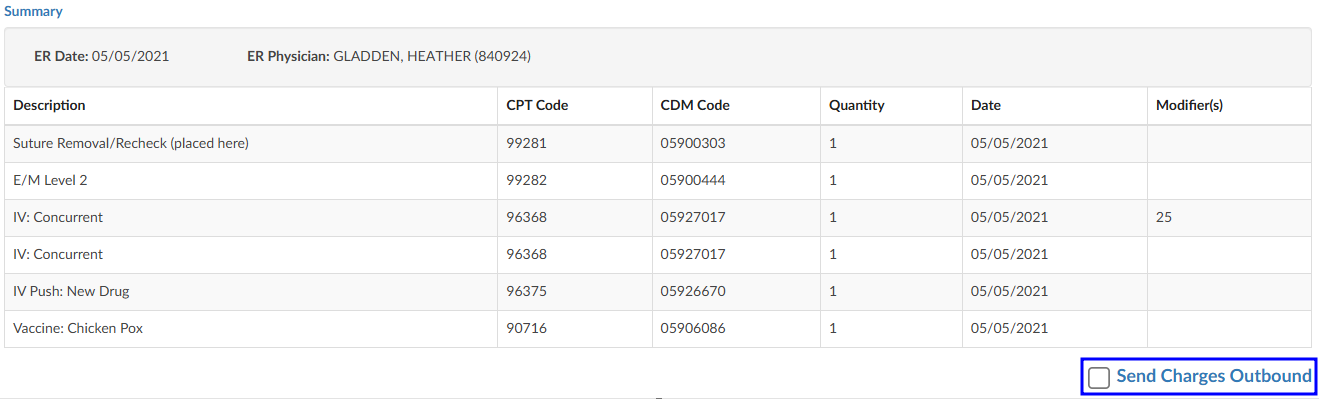
When all charging is complete and the charges are ready to be submitted, check the “Send Charges Outbound” checkbox and click on the Save button in the banner bar. This action sends charges out and the account will automatically route to a coder worklist so the rest of the coding that is not charge-related can be completed.
If the charges cannot be completed for some reason (missing trauma documentation), the box should NOT be checked, and instead, a pending reason should be assigned on the Code Summary. Once a pending reason has been added, click on the Save button in the banner bar.

If the “Send Charges Outbound” checkbox is NOT checked, the Coder will get a warning that ER charges are missing and will not be able to submit the account upon completion of coding. The Coder, in this case, would attach a pending reason to send the account back to the user applying charges to check the box. The account then goes back to the Coder to submit the account for final billing. This workflow ensures that the Coder does not submit an account unless all ER charges have been completed.
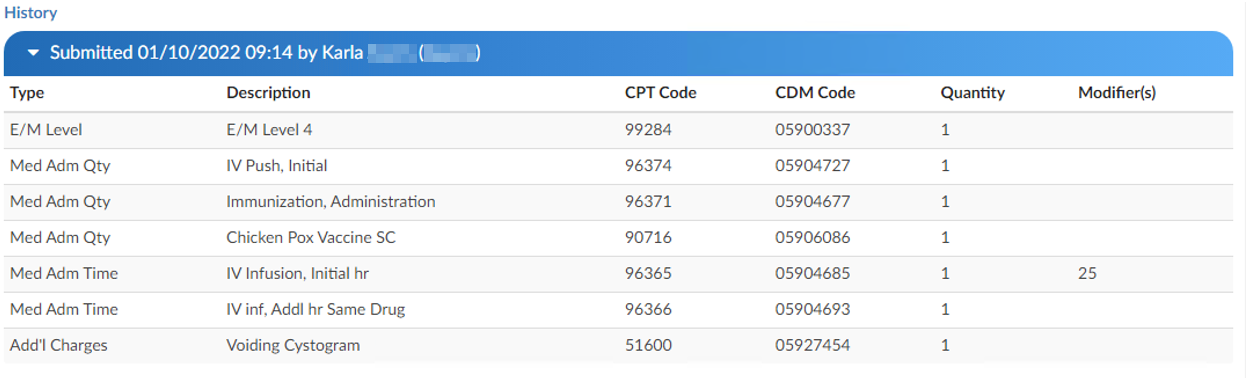
E/M History
This section displays the history of charges submitted.
Click to expand for details.
Physician Coding/Single Path
Physician Coders differ from hospital coders in that they will usually work for a doctor who specializes in a specific type of medicine. As a result, they typically code for just that specialty. These coders will only deal with a subset of the ICD10 code set. Within the CAC system, functionality is built to allow a Physician Coder to code charts just like hospital coding staff. The Single Path coding role allows the user to code an account as a final coder and a physician coder simultaneously. When a Single Path user opens up the detail on a CPT code, they will see two separate fields for modifiers, and they can enter modifiers for both.
A Single Path role can also be modified from the Profile drop-down menu under the user name at the top of the Account Detail screen, provided that another changeable profile role, such as CDI, Coder, or Physician Coder, is available on the User Profile. When adding or editing modifiers in the Charges viewer, the Single Path user sees the Coder’s version of the viewer, so what is added will be viewable to both a Coder and a Single Path user. The Physician Coder charges viewers are different and viewable only to them.
CDI/Clinical Alerts
The software has a feature called CDI/Clinical Alerts which are automated messages generated by the software
that can be used to prioritize CDI workflow. CDI/Clinical Alerts are used to detect potential inaccuracies,
inconsistencies, and/or discrepancies in clinical documentation. These Alerts help CDI teams to prioritize
the charts based on potential query opportunities available.
The software provides real-time Alerts when potential query opportunities are identified. Which will
then allow CDI staff to prioritize charts based upon those potential opportunities.
What is a CDI/Clinical Alerts Topic?
CDI/Clinical Alert Topics are the diagnosis that is being targeted by the Alert. The Topic encompasses a broad
range of diagnoses that address various issues being targeted by the system. These diagnoses then
branch out into more specific types known as Alerts. These are based on the type of issue being
targeted.
What is a CDI/Clinical Alerts Message?
The Alert message is a specific message that details what is missing, incomplete, and/or inaccurate
documentation that is missing with the Diagnosis/Topic that is being targeted.
CDI/Clinical Alerts Types
CDI/Clinical Alerts branch out into four (4) types of Alerts.
| Alert Type | Description |
|---|
| No Documentation but, Clinical Indicators | This Alert type is when the provider did not document a diagnosis but, there are clinical indicators that support “Possible Diagnosis”. |
| Documentation but lack of Clinical Indicators | This is where the provider documented the diagnosis but there is a lack of clinical indicators that support the diagnosis. For example, Sepsis was documented by the provider but it’s not supported by clinical indicators. This Alert helps to ensure that diagnoses are audit proof, ensuring that the supporting evidence requiered for a proper diagnsosis validation is present within the patient’s chart. |
| Documentation but Not Fully Specified | This is where the provider documented a diagnosis but, it was not documented to its full specificity. For example, Heart Failure Unspecified: the diagnosis is not documented to the full specificity. This CDI/Clinical Alert is helpful for ensuring that diagnoses are documented to their full extent in order to combat denials. |
| Conflicting Diagnosis | This alert detects instances where two or more fully specified versions of a diagnosis may conflict. For example, if one provider documents Acute Diastolic Heart Failure in one section of a patient’s record, while another records Acute on Chronic Systolic Heart Failure elsewhere, the alert flags the discrepancy. By ensuring diagnostic consistency, this alert helps maintain an accurate clinical picture, enabling all care providers to deliver the best possible care. |
Setting up CDI/Clinical Alerts
In order to set up CDI/Clinical Alerts, reach out to the SME Team (smeteam@dolbey.com) for
assistance. There is a module that must be deployed in conjunction with set up within the workflow
management editor.
Viewing CDI/Clinical Alerts
To access and view CDI/Clinical Alerts within a patient’s chart, locate them in the
Navigation tree and click on the “CDI/Clinical Alerts” viewer. This will make the viewer display in the middle of the screen. There is also a box with an arrow next to “CDI/Clinical Alerts” that will allow the user to pop-out the viewer in a different tab. Doing this gives the user the ability to move the tab to a different monitor, if desired.
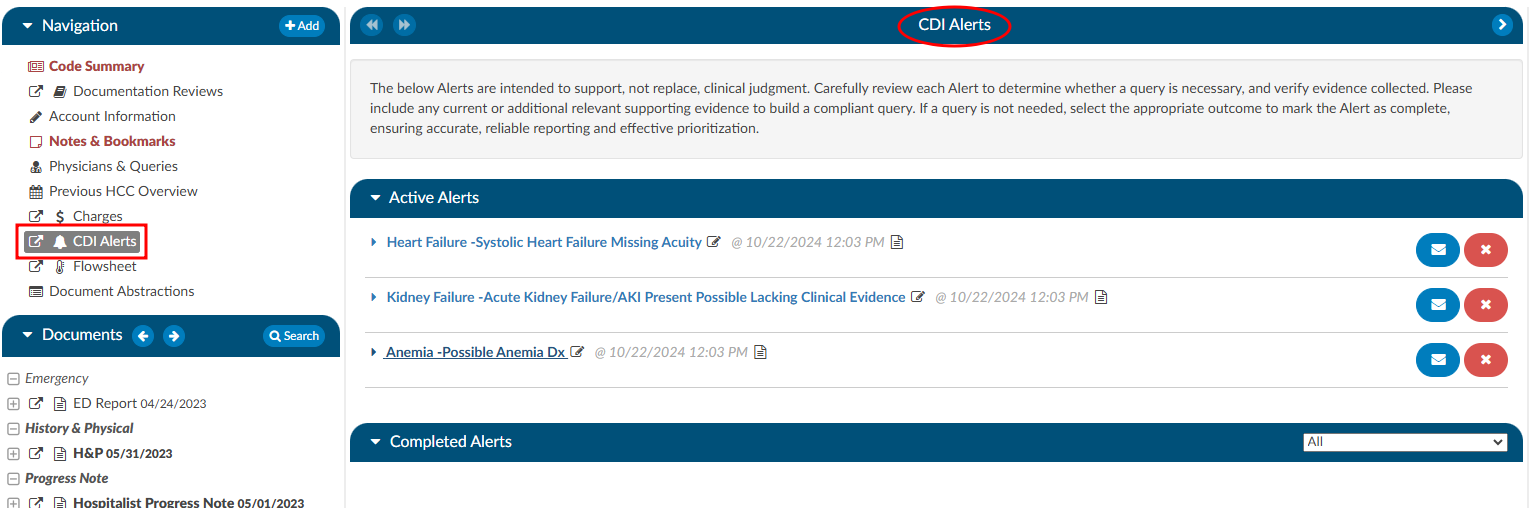
Navigating the CDI/Clinical Alerts Viewer
In the CDI/Clinical Alerts viewer there are two headings in the dark blue bars which include:
- Active Alerts; and
- Completed Alerts
Clicking on either of these headings will expand or collapse the section. Within each section are the actual Alerts that were triggered for the current account that is opened.
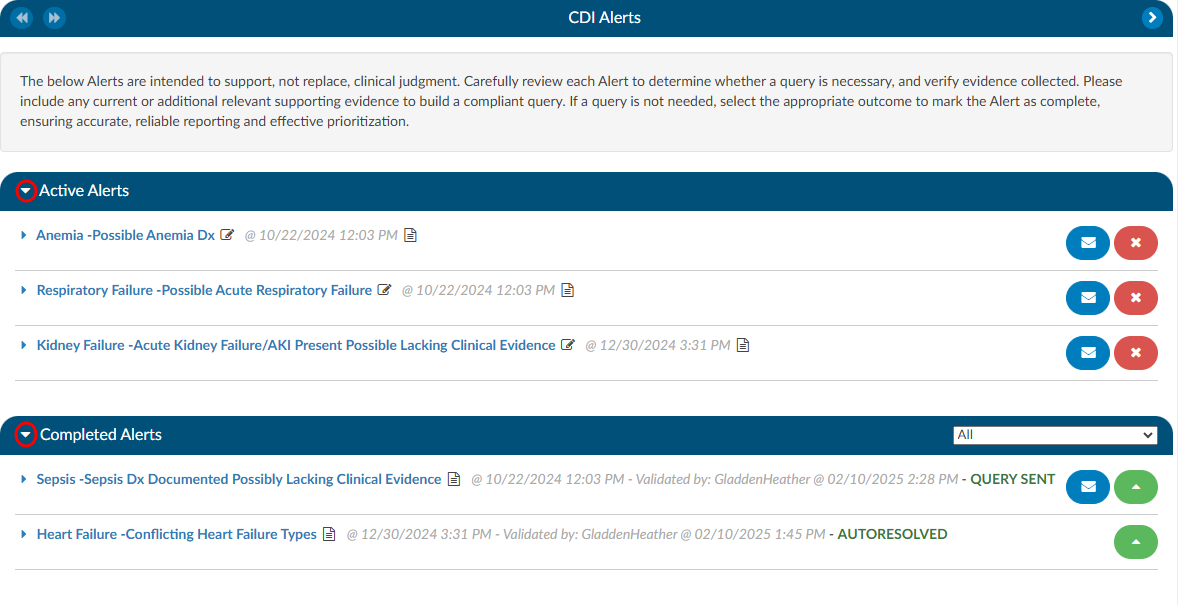
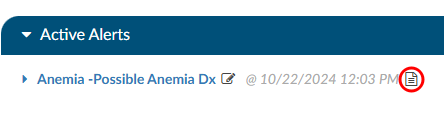
Active Alerts
The section “Active Alerts” are Alerts that the system found and no action has been taken to resolve them.
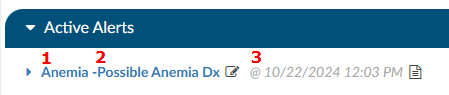
There are three parts to an Alerts title to observe:
- Alert Topic - This corresponds to a diagnosis.
- CDI/Clinical Alerts Message - This is a brief description of what the system found to be missing, incomplete, or possibly inaccurate and corresponds to the Topic.
- Date and Time - This is the date and time when the system found evidence for the alert to trigger. This information is tracked for reporting to see how quickly the system is triggering an alert.
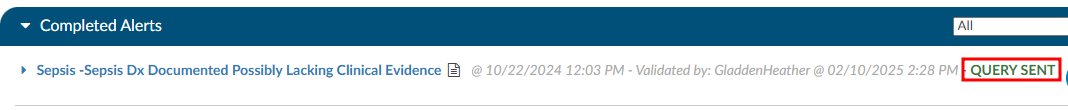
Completed Alerts
The section “Completed Alerts” are Alerts that have been closed in one of the following manners:
- Auto-Resolve by the system
- CDS initiates a query
- CDS clicks on the RED X next to the Alert
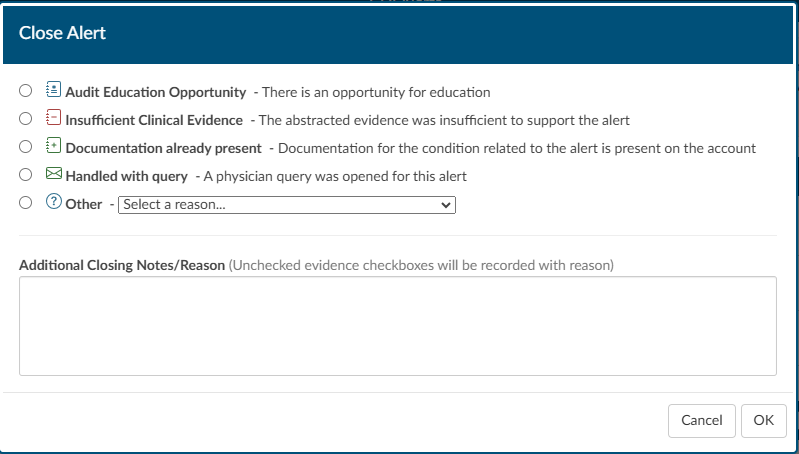
When choosing to close the Alert, the CDS will be presented with a “Close Alert” dialouge box to select why they are closing the alert.
The date and time stamp in the title of the Alert will indicate when the Alert was closed, and by whom. The title will also display GREEN
text that depicts how the Alert was closed.
CDI/Clinical Alerts Notes
Next to each of the Alerts in either the Active or Completed Alerts section is a paper icon.
When clicked, this icon will launch a notes page. This can be used by a CDS to leave a note if they do not feel the Alert currently has enough evidence to build a query, but also shouldn’t be ruled out as it could trend towards the diangosis alerted. Once a note is typed in it will leave the date and time as well as the CDS name so if another CDS enters the chart, they will be able to clearly see who chose to monitor the Alert at this time and why.
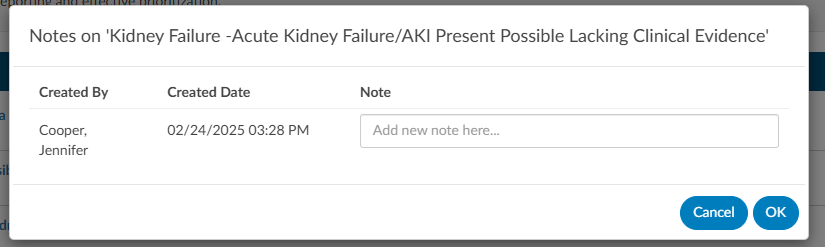
Upon adding the note the paper icon will turn RED , notifying the next user that is reviewing the CDI Alerts that there is a note present on the Alert.

Once a note is typed in it will leave the date and time as well as the CDS name so if another CDS enters the chart, they will be able to clearly see who chose to monitor the Alert at this time and why. Upon adding the note the paper icon will turn red, notifying the next user that is reviewing the CDI/Clinical Alerts that there is a note present on the Alert.
CDI/Clinical Alerts Editor Function
Adjacent to the Alert message, there is a pencil icon. Clicking on it will open an editor,
enabling the CDS to rearrange and customize the placement of evidence using a drag-and-drop functionality.
This feature empowers CDI professionals to organize their items in a personalized manner, aligning
with their specific querying requirements.
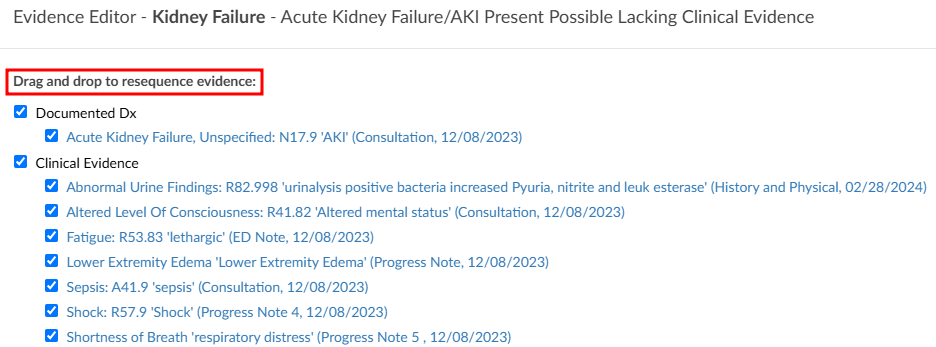
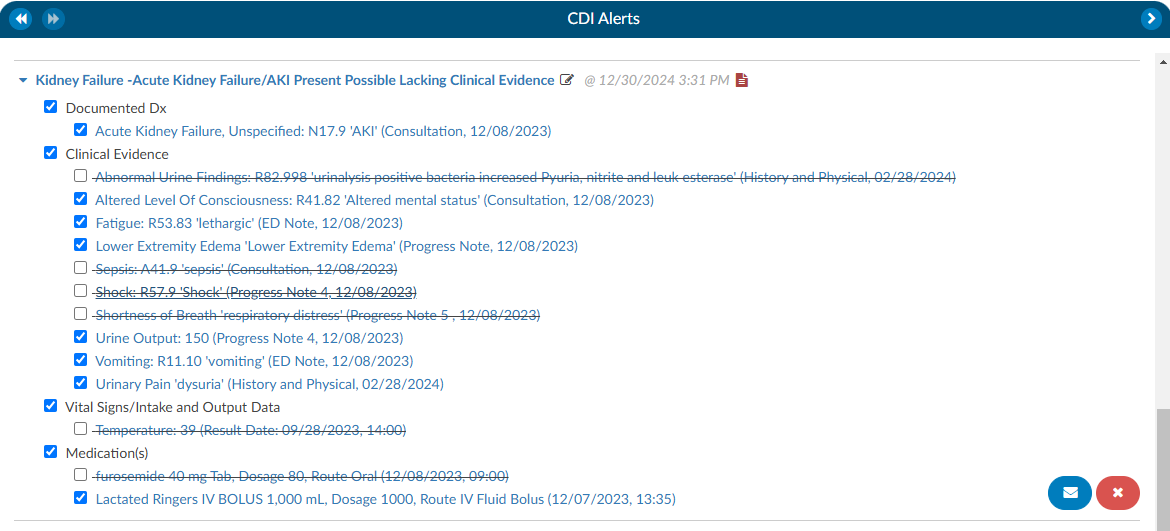
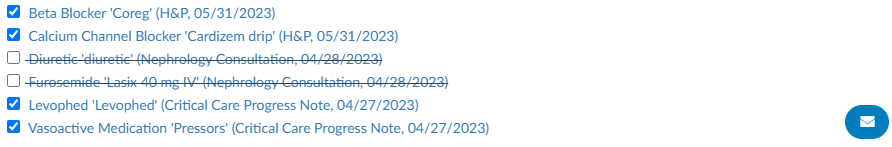
Reviewing Clinical Evidence
Each CDI/Clinical Alert contains clinical evidence extracted from the patient’s chart. There are four different
types of evidence that can be extracted.
- Words and phrases within documentation such as signs and symptoms, and medications.
- Value abstractions from the documentation such as vital signs or laboratory findings within physical documents.
- Code abstractions from documenation.
- Discrete values such as laboratory studies and vital signs found in the flowsheets, medications from the medication viewer and other flowsheet data.
The evidence in the Alerts are linked to documents within the patient’s chart, via a blue hyperlink, ensuring that the CDS directly connects to the relevant document associated with the Alert. This feature is especially useful for referencing specific documents that may be crucial to a particular Alert. The evidence is systematically categorized into sections such as Laboratory Studies, Clinical Evidence, Vital Signs, and Intake & Output Data.
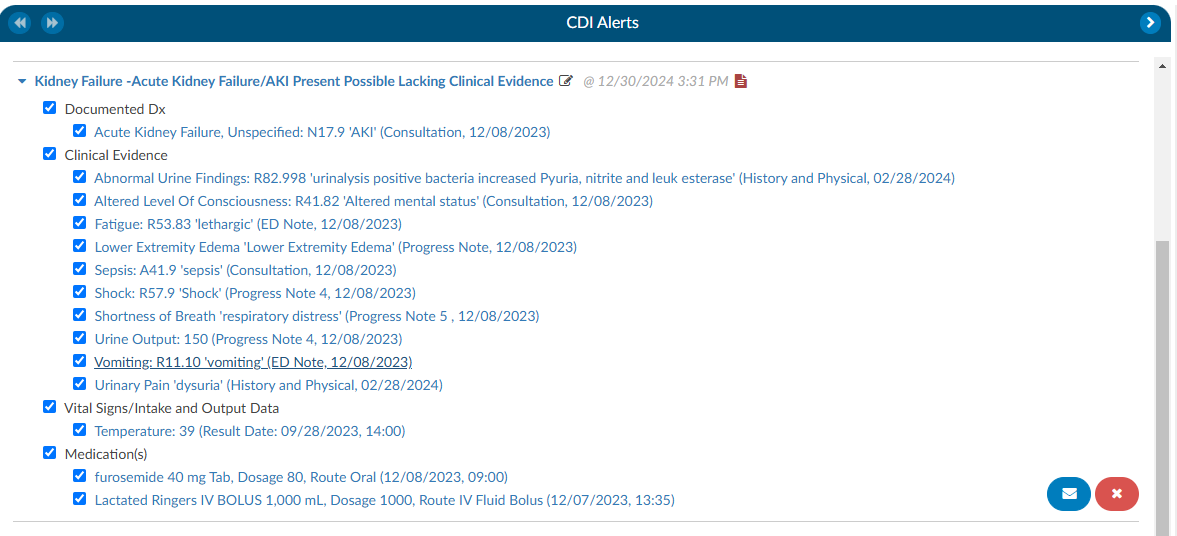
After the abstraction process, there will be words or phrases in quotes—these represent the terms the engine identified within the documentation or values. If the data is derived from a document, the document name and date are displayed; if obtained from flowsheets, the result date and time are shown.
For medication discrete abstraction, key details such as the medication name, dosage, route, and administration date and time are presented, ensuring essential context is provided.
When selecting evidence with a document type and date, a hyperlink will direct the CDS to the exact location in the document where the abstraction was found, with the relevant text highlighted in yellow. Additionally, there will bes green highlights within the documentation, marking abstractions specific to CDI/Clinical Alerts. These function similarly to code abstractions but are tailored for CDI rules.
Hovering over a green-highlighted abstraction will display which Alert the evidence is associated with, especially when multiple Alerts are present.

When clicking on a hyperlinked evidence that is followed by result date and time, indicating a discrete
value abstracted from the flowsheets, it will automatically take the CDS to the corresponding location in the
flowsheets and highlight the respective row.

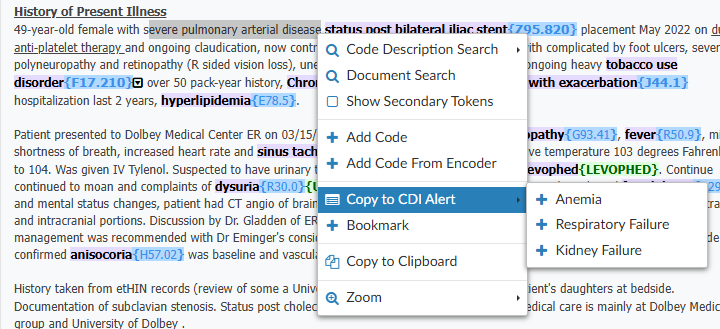
Another noteworthy capability within Clinical Evidence is the ease with which a CDS can incorporate
additional evidence. While reviewing documentation and flowsheets, if a CDS identifies items deemed
crucial for inclusion in the CDI/Clinical Alerts as supporting evidence for a query, they can effortlessly highlight
words or phrases in a document, up to a maximum of 1000 characters, and perform a right-click. This
action triggers a menu presenting various options, including one that reads “Copy to CDI Alert.” Clicking
on this option reveals a pop-out menu displaying available Alerts to which the evidence can be added.
Upon selecting the desired Alert, the system opens the Evidence Editor, allowing the CDS to specify
where the evidence should be attached. If the CDS clicks on existing evidence, the new evidence will be
attached below it. Once the evidence is copied over, the system provides details such as the evidence itself, the name of the document, and the date. For Laboratory Studies, it includes the result date and time.
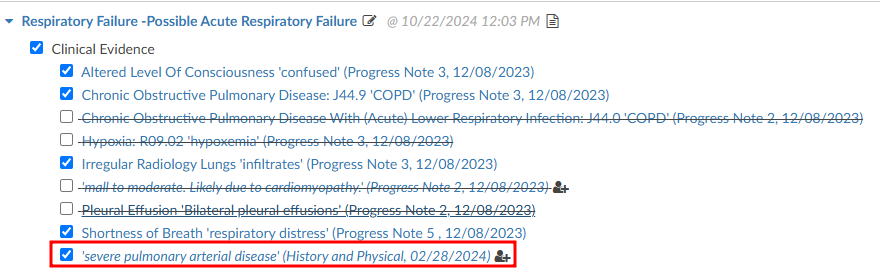
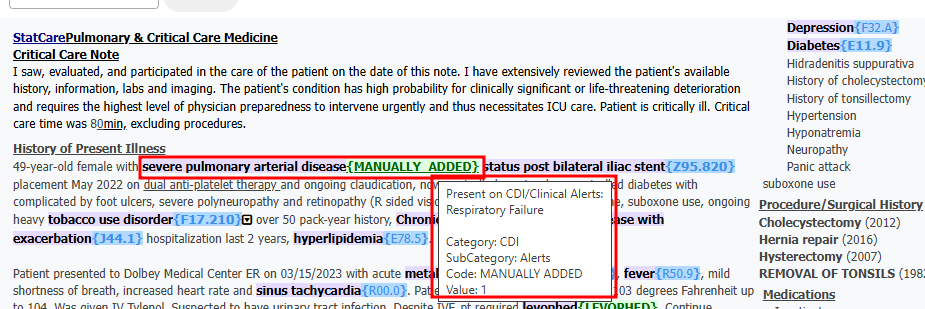
After incorporating the evidence into the designated alert, any highlighted evidence will be displayed in
the document in purple, accompanied by the phrase “MANUALLY_ADDED” in green at the end. This
informs the user that the evidence was added manually. Similar to other evidence, hovering over the
green-highlighted section will provide information about the CDI/Clinical Alert to which the item was applied.
When going back to the CDI/Clinical Alerts viewer there will be check boxes present next to the evidence
which serves two purposes. First, when a query is initiated, any evidence marked with a check mark will
be automatically copied to the clipboard allowing the CDS to conveniently paste the evidence into the query. This
copying action occurs when the clicking on the BLUE ENVELOPE
icon.
Second, unchecking any of the clinical evidence will put a strike through the text and it will prevent it
from being copied over. Additionally, any unchecked evidence will be reported back to Dolbey’s Clinical
Team if an Alert is closed due to it having invalid clinical indicator, insuffiecient clinical evidence, or
documentation is already present.
How to initiate a Query
In the right hand corner of the Alert there is see a BLUE ENVELOPE
icon next to a RED X icon. Clicking on the BLUE ENVELOPE
will launch the CDS into a query template.
Query
A query template will autoload for the specific Alert that is being queried. These templates can be set by the management staff specific to each organziation.
The evidence previously examined on the Alerts viewer page can now be effortlessly incorporated into
the query. When the query button is pressed, the selected evidence will be automatically copied to the
clipboard. This can be pasted using a simple process, either by pressing the “ctrl” and “v” keys, the
standard Windows keyboard shortcut for copying, or by performing a right-click and choosing the paste
option. After the query is submitted, the corresponding CDI/Clinical Alert will transition from the Active Alerts
section to the Closed Alerts section.
Once that query has been submitted that CDI/Clinical Alert will move from the Active Alerts section down to the
Closed Alerts section.
Autoresolve
The Alerts have the ability to autoresolve themselves if documentation comes in that would satisfy the
Alert. Once an Alert is Autoresolved it will move to the Completed Alert section. This will ensure that only Alerts that require attention are active for the CDS.
Closing Alerts without Querying
If it is determined that an Alert can be closed without initiating a query, a CDS can click on the RED X and the CDS will be presented with a “Close Alert” dialouge box to select why they are closing the alert (see the Completed Alerts section of this page).
Best Practices for Closing CDI/Clinical Alerts
The goal of this process is to ensure that end users provide actionable feedback directly within the CDI Alerts viewer. This helps streamline communication, create a consistent feedback loop, and provide a clear picture of system performance.
When reviewing an alert, the user should:
Assess the clinical evidence included in the alert.
Uncheck any inaccurate markers before closing the alert.
Select the appropriate closure reason from the list below.
End users have two ways to provide feedback on an alert:
Close a CDI Alert, or
Issue a Query.
Manual CDI Alert Closure Reasons
Audit Education Opportunity:
Indicates an opportunity for education when a CDI Specialist closes an alert as “Insufficient” but should have instead issued a query. Managers can click the green “Reopen” button, reopen the case, and update the closure reason to “Education”.
Important
This closure reason is for Managers only. CDI Specialists should not select this option.
Insufficient Clinical Evidence:
Indicated the abstracted clinical evidence is not sufficient to support the alert. In your opinion, the evidence does not justify the alert and it should not have triggered. The method of closure helps the tuning team identify alerts that may need refinement to improve accuracy.
Example: A patient chart triggers a bleeding alert because the patient is on anticoagulation therapy. However, the medication is being used to treat atrial fibrillation (Afib), not active bleeding. In this case, select Insufficient Clinical Evidence and include a short comment explaining why.
Documentation Already Present:
To be used when the diagnosis is already documented in the chart, whether or not it has a corresponding code. This method identifies cases where tuning or auto-resolution processes may need optimization.
Example(s):
- The diagnosis is documented and coded, but the alert failed to auto-resolve.
- The specialist manually adds the code, indicating that the system’s tuning logic may need adjustment.
Handled with Query:
For when a physician query was placed before the alert was reviewed to indicate the alert correctly identified a valid issue, but it was already being addressed. This type of closure confirms that the alert was accurate, but action was taken independently.
Example: The CDI specialist noticed the same clinical concern and issued a query before the alert triggered.
Other:
Used when the alert is closed for reasons unrelated to its accuracy or CDI performance. The below can be customized in the mapping table thus your organization may have different or additional options than shown below. This closure method should be used when the chart no longer requires a query or the reason does not fall into one of the previous categories.
Dropdown Options:
Alert Triggered but Queried for a Different Clinical Condition - Use when the alert led to identifying and querying for a different condition.
Chart Optimized for the Billing DRG - Use when the alert was correct, but the chart is already optimized and no query is necessary.
Coding Guidance Prohibits Coding of the Condition - Use when the alert triggered from data that cannot be coded due to coding rules or exclusions.
Condition or Diagnosis Is a Tuning Concern - Use when the alert triggered incorrectly because of an abstracting or coding error.
Adding Comments:
Comments are otptional, but encouraged. Users can add free-text comments when closing an alert to provide context for why the alert was closed. These comments help Dolbey’s development and tuning teams understand user perspectives and identifies patterns or potential system improvements.
Subsections of CDI/Clinical Alerts
Chart Prioritization
Once CDI/Clinical Alerts are enabled, within the workgroup there is a column named “Criteria
Group”. The name of this field may vary depending on the organization’s setup. If it is not visible, review Grid Column Configuration to determine whether it is displayed or labeled differently.
These criteria groups identify potential query opportunities based on algorithmic analysis. Once the algorithms meet the necessary criteria to trigger a CDI Alert, the alert is matched within the workflow. If it is the only alert present, it will be displayed as the “Criteria Group.”
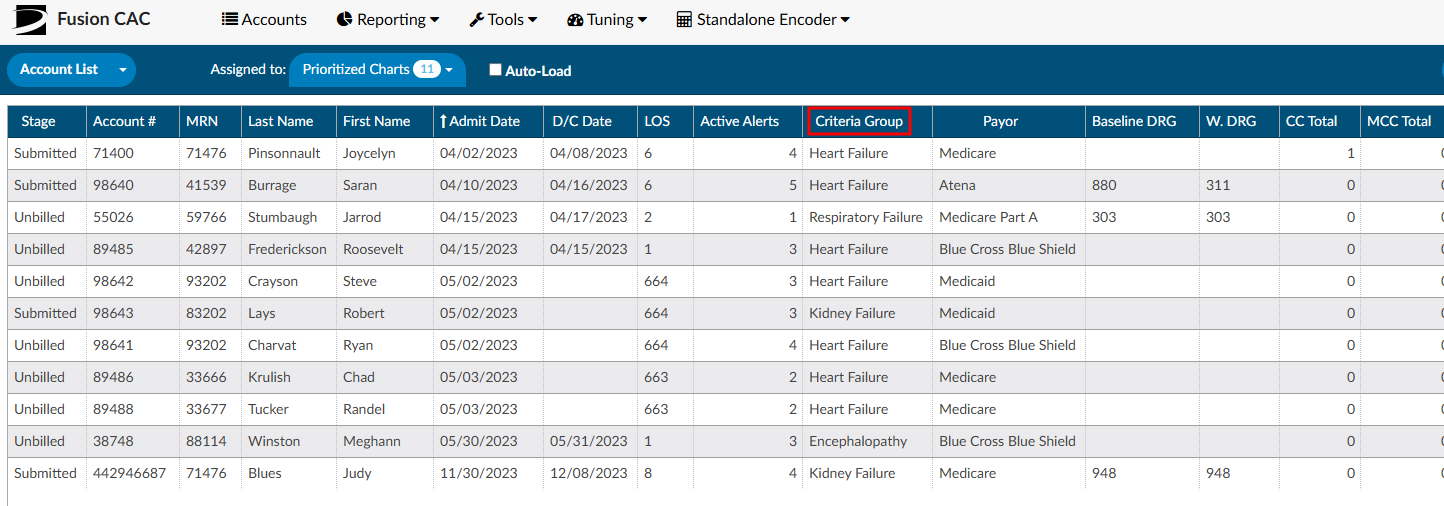
In cases where multiple Alerts match during workflow execution, the displayed Criteria Group name will
be determined by the hierarchical list. This hierarchical list is established by an organization’s management team
using the workflow management editor. The management team has the ability to rearrange the order of
the Alerts based on priority and initiatives at each organization, ensuring the Alerts are organized from
highest to lowest priority.
There is also a second grid column called “Active Matched Criteria Groups”. This column will display the
actual number of active CDI/Clinical Alerts on each account, regardless of the Alert being matched to something first as it goes thorugh workflow list. This column represents the total number of “potential” query opportunities in a patient chart.
The columns “Criteria Group” and “Active Matched Criteria Groups” are available for prioritizing the worklist. Of these, “Active Matched Criteria Groups” is particularly valuable, as it helps focus efforts on charts that require the most significant improvement. Utilizing this column allows for more effective resource allocation and workflow prioritization.
It’s important to note that the only Alerts that affect the Priority Criteria Group name and number of
Active Matched Criteria Groups are Active Alerts. Once an Alert is closed it will not be used in these
columns for prioritization. This helps to make sure charts with the most priority are getting in
front of the CDI Team. As Alerts are closed these numbers will be updated in real time.